
Racial Attitudes in America: Post-Racial in the Age of Obama Fails to Exist
Findings from the Blair-Rockefeller poll
On the heels of the 2010 midterm elections, the Diane D. Blair Center of Southern Politics and Society, together with Winthrop Rockefeller Institute, conducted a comprehensive online national poll of political attitudes and behaviors. TheBlair-Rockefeller Poll oversampled participants from the Southern region of the United States, as well as oversampling African Americans and Latinos, providing unique perspectives on contemporary politics. With over 3,400 respondents from across the nation, the Blair-Rockefeller Poll provides a comprehensive and uniquely accurate perspective on how the country evaluates public figures and current public policies – and how these evaluations vary across race and geographic region. Following the recent Republican take-over of Congress and the reported GOP gains resulting from voters’ negative reactions to a sluggish economy, the Blair-Rockefeller Poll included several questions asking respondents about their current economic situation as well as their future economic outlook.
Topic Report:
Racial Attitudes in America: Post-Racial in the Age of Obama fails to Exist
By Pearl K. Ford Dowe, Ph.D., Assistant Professor, Department of Political Science
The election of President Barack Obama increased expectations that America would transcend race and that white racial attitudes had undergone a fundamental transformation. Analyses of responses from all racial groups reveal that the presence of the first African American President and First Family has not alleviated racial stereotypes. The data also reveals that each racial group harbors negative evaluations and stereotypes of other groups. Racism is still a significant factor in the day to day experience of African Americans. There appears to be no regional difference among African Americans and Latinos in their experience with racial discrimination.
Race and Policy Preferences
Policies designed to address societal racial inequality are among the most controversial in our contemporary political debates. Much has been written on the limited support among whites for policies created to address racial equality. At the same time, however, there appears to be general support for the principles of equality. To some scholars, the gap between ideology and policy often reveals thinly veiled forms of racism. To others, the response is much more nuanced, suggesting that opposition to specific policies don’t represent racial animosity, but rather opposition to government intrusion into private affairs.
Fortunately, the Blair-Rockefeller asked respondents about the levels of discrimination various racial and ethnic groups experienced (See Table 1). Examination of this data reveals that race still significantly influences the day to day experiences of African Americans across the country. Eighty one percent of Southern African Americans and 80.3% of non-Southern African Americans reported experiencing discrimination in their day to day life. Latino respondents reported less discrimination in their lives compared to African Americans1 . Interestingly a considerable number of whites in both the South (48.1%) and in non-Southern regions (38.6%) expressed that they had experienced discrimination. However, in responses to more specific examples of racial discrimination these percentages decline (See Table 1).
Table 1. Life Experiences due to Race or Ethnic Background
| 1 Experience day to day discrimination |
2 Received Poorer Service | 3 Treated as if persons feared you | 4 Treated with Less Respect | 5 Called Names | 6 Physically Attacked/ Threatened |
7 Racially Profiled by Police | |
| Southern Whites | 48.1% | 34.5% | 18.8% | 46% | 28.9% | 14.4% | 14.6% |
| Non-Southern Whites | 38.6% | 28% | 15.5% | 36.7% | 22.1% | 14.7% | 10.4% |
| Southern Blacks | 81.4% | 69.3% | 58.1% | 76.9% | 37.6% | 19.2% | 43.8% |
| Non-Southern Blacks | 80.3% | 68.8% | 58.5% | 71.9% | 38.8% | 18.9% | 44.2% |
| Southern Latinos | 61.9% | 44% | 26.1% | 57.2% | 27% | 11.2% | 20.3% |
| Non-Southern Latino | 66% | 45.5% | 30.3% | 56.1% | 30.4% | 17% | 29% |
| In your day-to-day life, how often do any of the following things happen to you because of your racial or ethnic background? Would you say often, fairly often, once in a while, or never? 1You experience discrimination 2You receive poorer service than other people at restaurants or stores 3 People act as if they are afraid of you 4You are treated with less respect than other people 5You are called names or insulted 6 You have been physically threatened or attacked 7You have been unfairly stopped by police |
|||||||
In light of the racialized experiences reported above, it is expected that there is a gap between ideology and policy preference among whites in their support for specific policies designed to address racial issues (See Tables 2 and 3). The majority of Blacks and Latinos express strong concern that race and racial issues remain to be resolved. When asked if they felt that too much, too little or about the right amount attention is being paid to race only 47.2% of Blacks and 40.7% of Latinos felt that ‘too little attention’ was being paid. In comparison, only 14.1% of whites reported that ‘too little attention’ was being paid to race. There is little variation in these percentages when we compare across regions. A majority of Southern Whites (56%) and non-Southern whites (56%) felt too much attention was being paid to race. Only 17.8% of Southern Blacks and 18.5% of non-Southern Blacks agreed that too much attention was being paid to race. There is a similar pattern among Latinos as well with 22.8% of Latinos agreeing that too much attention is given to race and 27.9% of Southern Latinos agreeing that too much attention is given to race.
|
Table 2. Is too much, too little or right amount of attention paid to race and racial issues? |
|||
|
African Americans |
Whites |
Latinos |
|
|
Too Little |
47.2% |
14.1% |
40.7% |
|
Right Amount |
32.5% |
28.8% |
32.3% |
|
Too much |
18.2% |
56.0% |
24.6% |
| Source: 2010 Blair-Rockefeller Poll. This chart reflects the national response. Only 1.7% of the sample refused to answer this question. | |||
Contemporary research on racial attitudes has largely focused on whites support for racial equality – as well as White reticence to support policies to redress inequality. Academic research has devoted considerable time to understand the gap between support for equality and action to fix the problem. This gap was evident in a series of questions concerning the role of the federal government in ensuring equity in various areas of life even if it means increases in taxes (See Table 3). Whites were almost evenly divided when asked if it was the federal government’s responsibility to ensure that minorities had schools equal to their schools. Of the white respondents 49.6% agreed that it was the federal government’s responsibility compared to 48.8% of whites who said it was not the federal government’s responsibility. This pattern was also evident in response to a question asking about the federal government’s role to ensure equality in access to health care. Approximately 42% stated that government had a responsibility while 56.3% did not. However there is a major disconnect when it comes to federal support for indicators that impact school quality and health. Whites were not as supportive of federal government intervention when it comes to ensuring job equity. Only 29.6% felt it was the federal government’s responsibility. Similarly, 32.2% of Whites said it was the government’s responsibility to address housing equality. The poll revealed that African Americans nationwide maintained a liberal preference for policy choices with overwhelming support for government action. Comparatively Hispanics also reported strong report for government intervention.
| Table 3. Responsibility of the federal government to make sure that minorities have equality to Whites in the following areas. | |||
|
African Americans |
Whites |
Latinos |
|
|
Jobs equal in quality to whites? |
|||
|
Responsibility |
73.3% |
29.6% |
66.2% |
|
No Responsibility |
22.5% |
68.6% |
29.6% |
|
Schools equal in quality with whites? |
|||
|
Responsibility |
79.2% |
49.6% |
78.9% |
|
No Responsibility |
16.2% |
48.8% |
17.4% |
|
Housing equal in quality with whites? |
|||
|
Responsibility |
75.7% |
32.2% |
66.0% |
|
No Responsibility |
19.9% |
65.6% |
30.4% |
|
Health care services equal in quality to whites? |
|||
|
Responsibility |
78.7% |
41.7% |
77.3% |
|
No Responsibility |
16.4% |
56.3% |
18.9% |
|
Treatment by the courts and police equal to whites? |
|||
| Responsibility | 82.5% | 57.8% | 79.4% |
| No Responsibility | 12.1% | 40.7% | 15.5% |
Competition for Jobs and Perceptions of Opportunity
Looking next at employment and financial opportunity, we found that non-Southern Whites had the highest rate of employment with 54% stating they were paid employees2. Southern whites had a lower rate of employment of 43%. Among non-Southern Hispanic respondents, 47% reported working as a paid employee, while only 40% of Southern Hispanics reported working as a paid employee. There has been much attention given to the extremely high unemployment rate of African Americans nationwide and the findings from the Blair-Rockefeller Poll reflected this national trend with 47% of Southern African Americans reporting being employed and just 40% of non-Southern African Americans report working as a paid employee. In such a difficult economic climate, groups expressed quite different perceptions of their economic competition. Among African American respondents, 42.2% felt they had a lot of competition with whites for jobs. Similarly 42% of Whites felt competition with African Americans. Comparatively, neither African Americans nor Whites expressed much concern over competition with Latinos for employment. In fact, only 39% of African Americans and Whites stated they felt some competition with Latinos. In contrast, however, Latinos saw both African Americans and Whites as economic competition. In fact, 33.3% stated they had some competition with Blacks and 32.8% felt some competition with Whites.
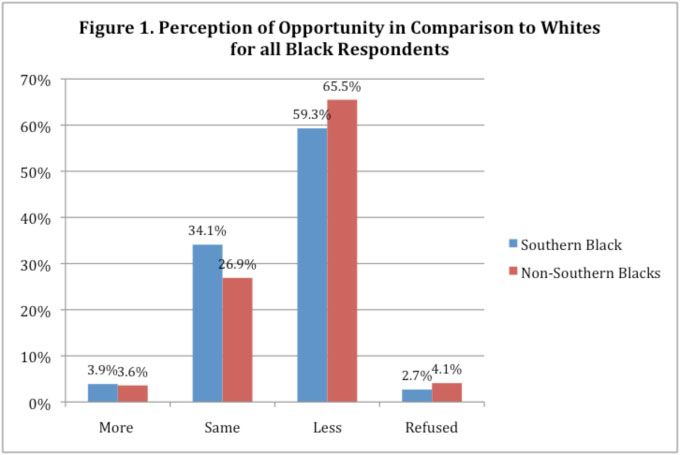
In addition, African Americans and Latinos expressed less optimism about their life opportunities compared to Whites. African Americans in non-Southern regions were less optimistic than Southern African Americans. This may be due to increasing economic disparities and declining quality of life in many urban areas throughout the nation. Nationally, 62.5% of African Americans felt they have fewer opportunities than whites and 41.4% of Hispanics feel they have less opportunity than whites. There is a regional difference in the perception of opportunity among African Americans with 65.3% of non-Southern African Americans feeling they have less opportunity than whites in comparison to 59.2% of Southern African Americans. In other words, Southern African Americans are more positive about their opportunities than African Americans living outside the South. There were no regional differences among Hispanics. While 42% of Southern Hispanics saw fewer opportunities than whites, 40.6% of Hispanics in the non-South see fewer opportunities than whites.
Stereotypes
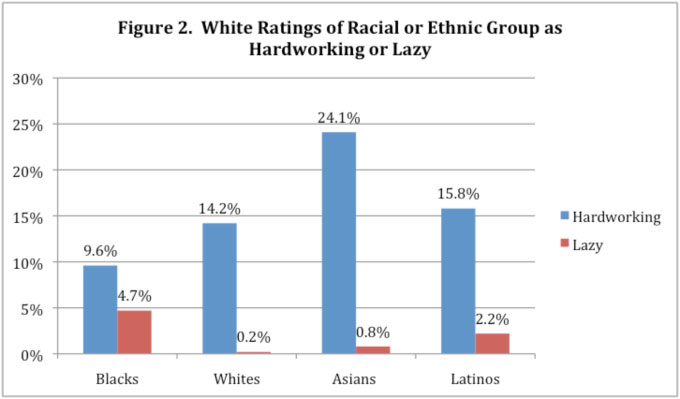
Long-standing racial stereotypes have been consistently portrayed in the media and have been studied extensively by scholars. According to many, however, the election of President Obama indicated the decline of racial stereotypes. Among the most common stereotypes of minorities include the propensity towards criminal behavior, increased aggression and limited intelligence. These stereotypes reinforce anti-black and anti-Latino attitudes in America. According to the Blair-Rockefeller Poll, the presence of the first African American family in the White House has unfortunately done little to alleviate these attitudes. Survey respondents were asked to rate other groups in terms of how hard working, intelligent and trustworthy they are (Table 4 and Figure 2). Looking at the data we see that Asians are viewed most intelligent by all groups. Blacks were perceived the least trustworthy by Latinos. Only 15% of Whites saw Blacks as intelligent although 39.7% of Blacks saw Whites as intelligent. These data reveal that negative stereotypes still exist and are held to some degree by all racial and ethnic groups.
| Table 4. National Group Responses to how they viewed other groups (Middle Values Omitted) | ||||||||
| Blacks Intelligent | Blacks Unintelligent | Latinos Intelligent | Latinos Unintelligent |
Whites Intelligent | Whites Unintelligent |
Asian Intelligent |
Asian Unintelligent | |
| Blacks |
44.2% |
.8% |
31.9% |
2.5% |
39.7% |
1.9% |
48.1% |
1.2% |
| Latinos |
22% |
5.6% |
32.3% |
.9% |
32.7% |
1.3% |
40.8% |
1.1% |
| Whites |
15.5% |
1.3% |
13.6% |
1.8% |
20.7% |
.1% |
27.5% |
.4% |
| Blacks Trustworthy | Blacks Untrustworthy | Latinos Trustworthy | Latinos Untrustworthy | Whites Trustworthy | Whites Untrustworthy | Asian Trustworthy | Asians Untrustworthy |
|
| Blacks |
26.5% |
2.1% |
19.2% |
3.8% |
16.7% |
8.0% |
21.1% |
2.9% |
| Latinos |
13.2% |
15.1% |
22.3% |
2.4% |
17.9% |
4.6% |
16.4% |
4.1% |
| White |
11.3% |
4.4% |
9.8% |
2.6% |
13.3% |
.5% |
12.7% |
1.5% |
According to some observers, the 2008 presidential election ushered in a new era in which racial animus and barriers to equality no longer existed. The data presented here reveal that there is a relevant and stark racial divide in perceptions and policy support. Whites seem to remain less supportive of policies designed to improve equality, particularly in comparison to African Americans and Latinos. This reality is also reflective of the life experiences expressed by African Americans. Will America eventually move to a post-racial society? That is difficult to tell but what is clear is that different racial perspectives have yet to converge.
Methodology
Knowledge Networks (www.knowledgenetworks.com) administered the Blair-Rockefeller poll immediately following the 2010-midterm elections. Its proprietary database contains a representative sample of Americans; covering traditionally hard-to-survey populations such as cell phone-only households, and households without Internet access (estimated at 23% and 30% of all households, respectively).
The Blair-Rockefeller Poll has a total sample of 3,406 individuals aged 18 years or older including 932 Latinos, 825 African Americans, and 1,649 non-Hispanic white respondents. Across all racial and ethnic categories 1,689 respondents lived in the South, and 1,717 respondents lived in the non-South. The average survey took 21 minutes to complete. Finally, respondents had the choice to complete the survey in either Spanish or English, 2,946 completed it in English, while 460 completed it in Spanish.
Contact:
Pearl K. Ford Dowe, Ph.D.
Assistant Professor of Political Science
University of Arkansas
479-575-6434
pkford@uark.edu
1 See “Latino Views Diverge Based on Nativity” Rafael Jimeno, for more details on Poll findings concerning Latinos.
2See “The Economy across Race and Region: Unemployment Fails to Dampen Positive Outlook Among African Americans and Latinos” by Todd Shields for more Poll findings concerning economic outlook.