
Southern Political Attitudes: Geography versus Identity
Results from the 2012 Blair Center-Clinton School Poll
Report prepared by Angie Maxwell, Ph.D.
In November 2012, the Diane D. Blair Center of Southern Politics and Society, part of the J. William Fulbright College of Arts and Sciences at the University of Arkansas, along with the University of Arkansas Clinton School of Public Service, conducted a national poll with oversamples of southerners, African Americans, and Latinos. The 2012 Blair Center-Clinton School (BCCS) Poll followed the 2010 Blair Rockfeller Poll, which began to uncover a more nuanced picture of southern politics within the larger American political landscape. The national sample included 3,606 respondents, with 1,792 participants living in the geographic South, defined here as the 11 states that formed the Confederate States of America. The sample also included 1,110 Latino, 843 African American, and 1,653 non-Hispanic white respondents.
Though the South remains dominantly Republican, Barack Obama won three southern states in 2008 (Florida, North Carolina, and Virginia) and repeated victories in two of those states in 2012 (Florida and Virginia). These small cracks in the “Solid South” invite deeper research into the cleavages among southern residents. In terms of voting and elections, the South must, of course, be measured by geographic residence.
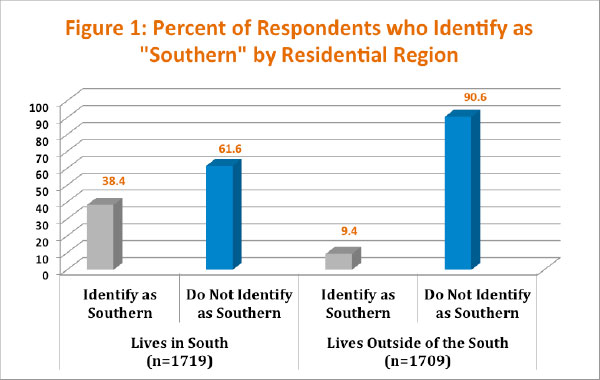
Distinctiveness, if it does indeed still exist, should be considered beyond state borders. Thus, the BCCS Poll measured region by residence and by identity. Figure 1 reveals that only 38.4% of those who currently live in the South identify as “southern.” But is this designation useful in considering political campaigns or support for public policies? Table 1 compares responses among not only geographic southerners and non-southerners, but also those who claim a southern identity.
| Table 1: Public Opinion by Geographic Residence (South vs. Non-South) and by Identification as Southern | |||
| N= 3606 for geography, N=3428 for identity (answers indicated in red) |
Lives in South |
Lives outside the South |
Identifies as Southern |
| Biblical Literalists |
39.0% |
31.0% |
44.3% |
| Experience Discrimination based on your race (never) |
45.0% |
43.4% |
38.4% |
What it takes to be “fully” American?
|
44.1% |
42.1% |
52.9% |
Do you believe it is the responsibility of the federal government to make sure minorities have equality with whites in each of the following areas, even if it means you will have to pay more in taxes?
|
48.4% |
51.1% |
47.9% |
Do you favor or oppose:
|
45.3% 36.0% |
42.2% 28.9% |
54.1% 40.6% |
| View on Abortion: (by law, abortion should never be permitted) |
13.7% |
11.0% |
15.2% |
| Humans and other living things: (created by a supreme being in their present form since the beginning of time) |
32.0% |
27.2% |
37.6% |
| Is there solid evidence of the earth is warming? (No) |
19.8% |
15.6% |
21.0% |
2016 Presidential Race Pairings among independents
|
56.1% |
57.3% |
59.5% |
Religion is often cited as one of the primary distinctive traits of the American South, which has long been nicknamed the Bible Belt. As religious denominations multiply and diversify, the simple question regarding one’s view of the Bible offers insight into the percentage of the community that is literalist or, what is sometimes called, fundamentalist. Here there is a geographic gap of 8% between participants who live in the South (39%) and those who do not (31%) who reported believing in a literal interpretation of the Bible. Additionally, southern identity significantly broadens this gap, with 44.3% holding a literal view of the Bible.
The same pattern exists when respondents were asked about evolution, with 32.0% of geographic southerners claiming that humans and other living things were “created by a supreme being in their present form since the beginning of time,” compared to 27.2% of those who reside outside the South. This percentage increase to 37.6% of those who identify as “southern.” However, despite the strong religious culture in the South, the most extreme pro-life view which would prohibit abortion in all cases is only held by 13.7% of geographic southerners, 11.0% of geographic non-southerners, and 15.2% of those who claim a “southern” identity.
Still other questions demonstrated this two-fold difference, with, for example, a greater percentage of geographic southerners than those who live outside the South reporting that being white and Christian, as well as being native born and speaking English well are “very important” to being considered “fully” American. And, in each case, this percentage increases if the respondent claims a southern identity. Similar gaps exist, as demonstrated in table 1, in terms of support for strict immigration laws like those in Arizona, opposition to health care reform, and denial of global warming.
On the other hand, feeling “southern” and living in the South do not affect views on the federal government’s role is promoting equity in housing, jobs, health care, treatment by the courts, or education, though there is less support in every case than those who live outside of the South. Moreover, only slight differences exist between geographic southerners and “feel southerners” in 2016 presidential pairings of front-runner Hillary Clinton and potential Republican challengers, Governor Chris Christie, former Governor Jeb Bush, and Senator Marco Rubio. In one case, Clinton’s support is highest from those who live outside the South (Clinton vs. Bush), but those who claim as southern identity are a close second. The pattern is reversed in the hypothetical races against Rubio and Christie, with the greatest percentage of support for Clinton coming from those who identify as “southern.”
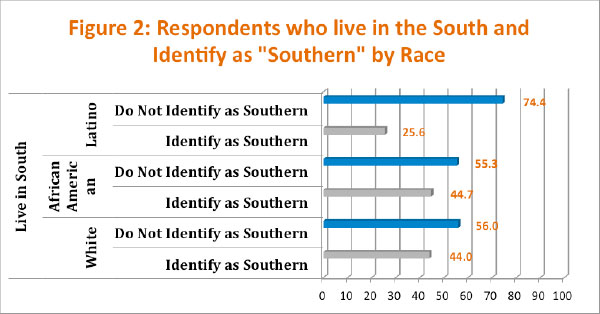
Since identity and geography are distinct measures of southerness, with separate impacts on political attitudes, a deeper investigation of those who “feel southern” is required. Too often the “southern” label is limited solely to white southerners. However, Figure 2 reveals that an equal (slightly greater) percentage of African Americans (44.7%) in the geographic South claim a southern identity as compared to whites (44.0%); moreover, more than a quarter (25.6%) of Latinos who are living in the South self-identify as “southern.”
However, as Table 2 demonstrates, this label is not universal. There are clear and substantial differences been whites, African Americans, and Latinos who identify as “southern.” For example, a significantly higher percentage (58.5%) of African Americans “southerners” are Biblical literalists, and in three of the four questions regarding the definition of being “fully” American, a larger portion of African American “southerners” consider it “very important” to be native born, Christian, and to speak English well. Only 36.7% of Latino “southerners” hold a literal view of the Bible, yet they report the largest percentage (21.5%) of support for complete prohibition of abortion, compared to only 6.7% of African American “southerners.”
A definite pattern exists when looking at attitudes toward federal support for racial equity in jobs, health care, education, housing, and treatment by the courts, with the greatest percentage of support coming from African Americans, followed by Latinos, then whites with the significantly less support. Opposition to health care reform, denial of climate change, opposition to strict immigration reform (the Arizona model), and support for Hillary Clinton in all three pairings also follow this same pattern.
| Table 2: Public Opinion of Respondents who Live in the South and who Identify as “Southern” | |||
| N= 1719 who live in South, N=820 who feel “southern” (answers indicated in red) |
White |
African American |
Latino |
| Biblical Literalists |
40.0% |
58.5% |
36.7% |
| Experience Discrimination based on your race (never) |
52.1% |
12.0% |
40.3% |
What it takes to be “fully” American?
|
50.9% |
64.7% |
43.5% |
Do you believe it is the responsibility of the federal government to make sure minorities have equality with whiles in each of the following areas, even if it means you will have to pay more in taxes?
|
27.7% |
76.8% |
57.1% |
Do you favor or oppose:
|
75.3% 65.7% |
38.4% 6.7% |
27.7% 27.2% |
| View on Abortion: (by law, abortion should never be permitted) |
17.0% |
6.7% |
21.5% |
| Humans and other living things: (created by a supreme being in their present form since the beginning of time) |
38.5% |
40.6% |
31.9% |
| Is there solid evidence of the earth is warming? (No) |
28.6% |
12.1% |
15.2% |
2016 Presidential Race Pairings overall
|
37.5% |
90.6% |
70.7% |
As previously mentioned, despite the distinctiveness of southern identity, elections are based on residence; thus, a closer look at white southerners by party identification reveals the true nature of partisanship within the region. Figure 3 shows that in the BCCS Poll’s oversample of 1,792 geographic southerners, 28.5% identify as Democrats, 18.0% as Independents, and 53.5% as Republicans.
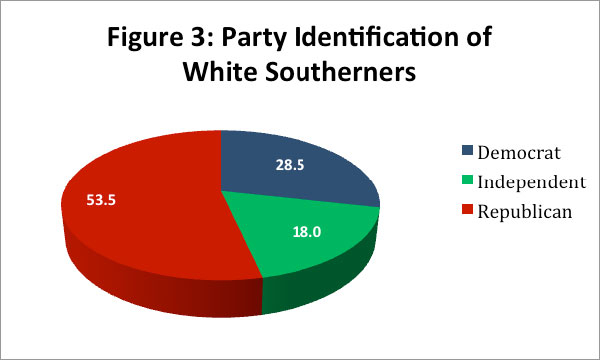
Table 3 sheds additional light on these differences. Not surprisingly, the largest percentage (37.8%) of Biblical literalists identify with the Republican Party. Similarly, 16.7% of southern Republicans hold the strictest view on abortion, compared to 11.7% of southern Independents, and only 3.5% of southern Democrats. A greater percentage (30.2%) of southern Republicans indicate that one must be Christian to be considered “fully” American. However, in every other sub-definition of American authenticity, southern independents are the most likely to report that being white, native born, and able to speak English well are necessary. A further distinguishing feature of southern Republicans is that a significantly smaller percentage (49.1%) report never having experienced discrimination based on, in this case, their whiteness, indicating that a higher percentage of southern Republicans have experienced some level of racial discrimination.
| Table 3: Public Opinion of White Respondents who live in the South by Party Identification | |||
| N= 819 white respondents who live in the South (answers indicated in red) |
Democrat |
Independent |
Republican |
| Biblical Literalists |
14.0% |
26.9% |
37.8% |
| Experience Discrimination based on your race (never) |
68.1% |
52.4% |
49.1% |
What it takes to be “fully” American?
|
29.7% |
48.3% |
46.2% |
Do you believe it is the responsibility of the federal government to make sure minorities have equality with whiles in each of the following areas, even if it means you will have to pay more in taxes?
|
48.9% |
35.9% |
17.9% |
Do you favor or oppose:
|
39.3% 13.5% |
66.2% 41.4% |
86.1% 85.6% |
| View on Abortion: (by law, abortion should never be permitted) |
3.5% |
11.7% |
16.7% |
| Humans and other living things: (created by a supreme being in their present form since the beginning of time) |
17.9% |
27.6% |
40.8% |
| Is there solid evidence of the earth is warming? (No) |
8.3% |
17.9% |
37.1% |
2016 Presidential Race Pairings overall
|
88.2% |
49.7% |
14.2% |
In policy preferences, the highest percentage of southerners who opposed health care reform (85.6%), support strict immigration policies (86.1%), deny global warming (37.1%), and hold a creationist view toward evolution (40.8%) are Republicans. Likewise, southern Democrats are more likely to assign responsibility to the federal government to insure equity between whites and minorities in terms of access to jobs, housing, health care, and the courts treatment by the courts. And nearly 60 years after Brown v. Board of Education, only 31.3% of southern Republicans think the Federal Government should ensure equity in education even if it means raising taxes, compared to 46.2% of southern independents, and 67.7% of southern Democrats.
Just as party labels have changed over time, the southern label is also in flux. This has profound implications on the politics of the region and how we understand political attitudes.
Methodology
The Blair Center-Clinton School Poll is a national survey that was fielded immediately following the November 2012 presidential midterm election. The BCCS Poll was administered by Knowledge Networks (www.knowledgenetworks.com), an internet based survey company that includes a representative sample of Americans in its proprietary database including representation of the roughly 30% of U.S. households that do not have internet access. In addition, it covers the growing number of cell phone only households (recently estimated at 23% of all households) through address-based sampling.
The survey probed national and regional issues of concern to the population of the United States and was conducted in both English and Spanish. The average survey took approximately 21 minutes to complete. The 2012 BCCS Pollincluded a total sample of 3,606 individuals who were at least 18 years old. The margin of error is +/-2.4. The survey contains a representative sample of each of the following groups: southern African Americans, non-southern African Americans, southern Latinos, non-southern Latinos, southern whites and non-southern whites. The margin of error for each of these groups is less than +/-2.5.