
The Economy across Race and Region: Unemployment Fails to Dampen Positive Outlook Among African Americans and Latinos
A Report from the 2012 Blair Center-Clinton School Poll
Report prepared by Todd Shields
On the heels of the 2012 presidential election, the Diane D. Blair Center of Southern Politics and Society in the University of Arkansas J. William Fulbright College of Arts and Sciences, together with the University of Arkansas Clinton School of Public Service, conducted a comprehensive online national poll of political attitudes and behaviors. The 2012 Blair Center-Clinton School (BCCS) Poll oversampled participants from the southern region of the United States, as well as oversampling African Americans and Latinos, providing unique perspectives on contemporary politics. With more than 3,600 respondents from across the nation, the BCCS Poll provides a comprehensive and uniquely accurate perspective on how the country evaluates public figures and current public policies – and how these evaluations vary across race and geographic region.
This is the second national poll conducted by the Blair Center. Following the 2010 midterm elections, the Blair Center also conducted a national survey with oversamples of African Americans and Latinos. In the context of a continued sluggish economy, these two surveys provide unique insights into how negative financial situations influence different groups and how those attitudes have changed during the past two years. In addition to questions assessing respondents’ current economic situations, the BCCS Poll also included several questions asking respondents about their expectations of their future economic prospects.
Recent news reports suggest that the economic recession may have hurt some groups more than others, particularly African Americans and Latinos. The findings from the BCCS Poll indicate that while unemployment rates are substantial among African Americans and Latinos, these groups still have surprisingly optimistic views of their economic future.
The survey reveals substantial regional variations – with African Americans from the South reporting comparably more positive expectations. While previous research suggests that high unemployment rates result in election backlash for the incumbent party, current economic conditions have not translated into negative views of the future among African Americans and Latinos. These findings challenge long-held assumptions about the impact of the economy on political attitudes and behaviors and may require scholars and political strategists to reconsider previous approaches during future elections.
Unemployment
Looking first at overall unemployment levels, the survey revealed substantial percentages of people who reported that they were unemployed for various reasons.
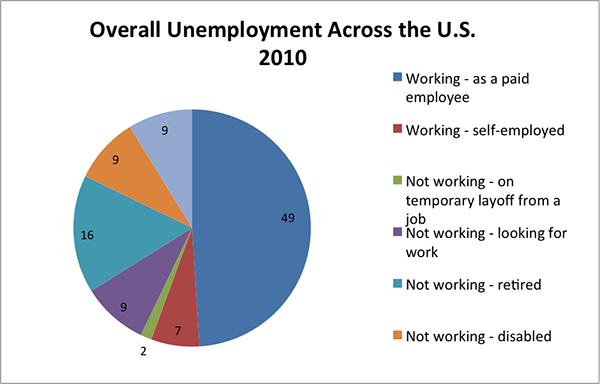
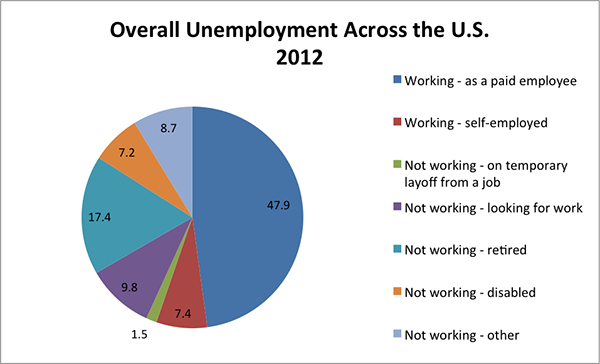
Looking first at the entire survey from 2010 and 2012 we don’t see a great deal of change as the sluggish economy continued through both the midterm and presidential election. We see that the percentage of respondents who reported that they were working as a paid employee fell slightly from 49% in 2010 to 47.9% in 2012. The percentage of respondents who were self-employed remained stable moving from 7% to 7.4%. The percentage of respondents who were looking for work also remained relatively stable from 9% to 9.8%. The percentage of respondents who were retired increased slightly from 16% to 17.4%, while the percentage who indicated that they were not working because of a disability decreased from 9% to 7.2%. Finally, those who reported that they were not working for other reasons remained basically the same from 9% to 8.7%.
While these numbers reflect the negative national economic news that has become so common during the past few years, examining regional differences between the South and the non-South reveals some important variations.
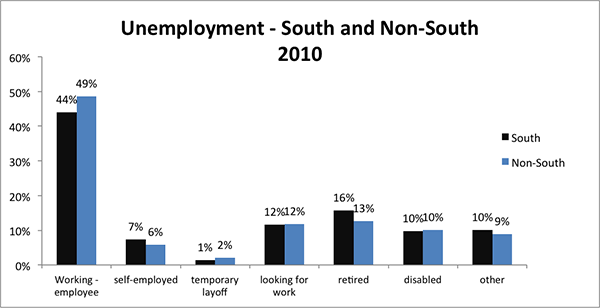
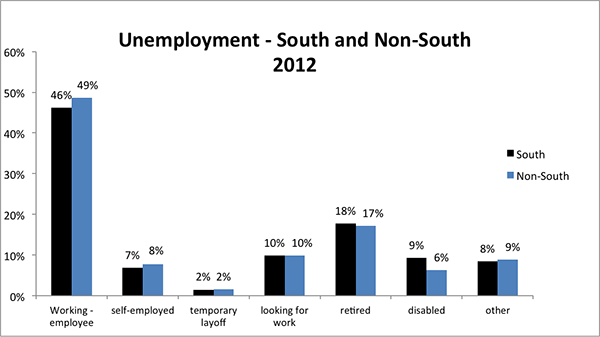
The percentage of respondents reporting that they were working as an employee increased slightly among southern respondents from 44% in 2010 to 46% in 2012. Among non-southern respondents, however, the percentage remained stable at 49%. There was also an increase in the percent of southern respondents who reported that they were self-employed from 6% to 8%. The percentage who were looking for work increased from 10% to 12% for both southern and non-southern respondents. There was an increase in the percentage reporting that they were retired in the South from 16% to 18% and from 13% to 17% in the non-South. Overall, while the regional differences are not large, there was an increase in the percentage of southern respondents who reported that they were working. In any negative economy, even slight improvements in economic standing are important.
Examining differences across both race and region, we again find very interesting variations.
Unemployment Across Race and Region
2010
| Working, paid employee | Working, self-employed | Not working, temporary layoff | Not working, looking for work | Not working, retired | Not working, disabled | Not working – other | |
| Southern White | 43% | 8% | 1% | 9% | 22% | 8% | 9% |
| Non-Southern White | 54% | 6% | 1% | 6% | 18% | 8% | 8% |
| Southern African American | 47% | 4% | 2% | 13% | 13% | 16% | 6% |
| Non-Southern African American | 40% | 5% | 2% | 21% | 12% | 17% | 4% |
| Southern Latino | 43% | 9% | 2% | 16% | 8% | 7% | 15% |
| Non-Southern Latino | 47% | 6% | 4% | 14% | 4% | 8% | 16% |
Unemployment Across Race and Region
2012
| Working, paid employee | Working, self-employed | Not working, on temporary layoff | Not working, looking for work | Not working. retired | Not working, disabled | Not working, other | |
| Southern White | 49% | 8% | 1% | 8% | 19% | 6% | 8% |
| Non-Southern White | 47% | 5% | 1% | 15% | 13% | 11% | 9% |
| Southern African American | 48% | 6% | 4% | 14% | 9% | 4% | 15% |
| Non-Southern African American | 48% | 7% | 1% | 7% | 21% | 8% | 8% |
| Southern Latino | 41% | 6% | 2% | 20% | 14% | 13% | 4% |
| Non-Southern Latino | 45% | 9% | 4% | 10% | 9% | 9% | 14% |
The percentage of southern whites who reported that they were working as a paid employee increased by 6 points from 43% in 2010 to 49% in 2012. A 6% increase among southern respondents is substantial in an economy that has been very slow to show signs of improvement. Further, non-southern whites did not experience the same changes. In fact, non-southern whites reported a 7% decrease among those reporting to be working as a paid employee.
As expected, the decrease in working non-southern whites is accompanied with an increase in the percentage of non-southern whites who are looking for work, which rose from 6% in 2010 to 15% in 2012. The percentage of southern African Americans who are working remained stable at 47% to 48%, while working non-southern African Americans is up from 40% to 48%. So, while the percentage of working African Americans is up overall, the increase was 8% in the non-South and only 1% in the South. In fact, the percentage of non-southern African Americans who reported that they were looking for work fell from 21% to 7%. Comparatively, among southern African Americans, the percentage of respondents who reported that they were looking for work remained relatively stable at 13 to 14%. Among Latinos, the biggest change was among southerners who were looking for work. The percentage increased from 16% in 2010 to 20% in 2012. Overall, the groups that showed the most improvement, at least in terms of unemployment were southern whites and non-southern African Americans.
Retrospective and Prospective Economic Evaluations
While the unemployment percentages are uneven across groups, another way to evaluate the overall effects of the economic downturn is to examine how an individual’s personal economic situation changed during the past year and if they expect their economic situation to improve during the coming year.
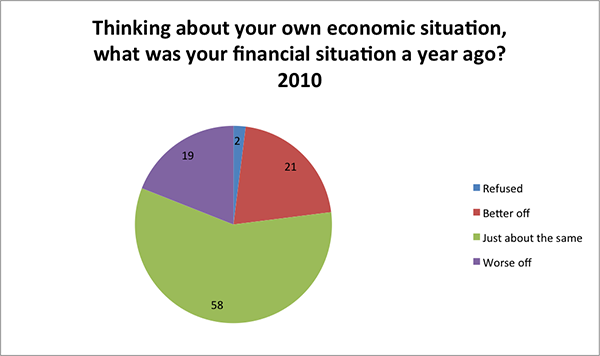
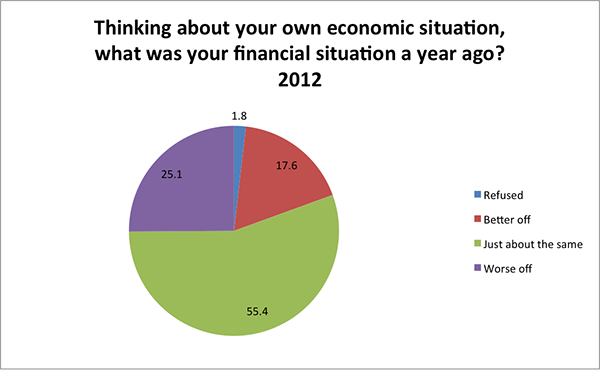
First, we see that the percentage of participants who said they were “worse off” a year ago, and are therefore doing better now, increased from 19% in 2010 to 25.1% in 2012. This is a sizable increase in the percentage of respondents who reported that they are doing better in 2012. The percentage of respondents indicating that they were better off a year ago, and therefore doing worse now, decreased from 21% to 17.6%, a 2.4% change in the percent of respondents who are doing worse in the current year. Finally, the percentage of respondents who said things were about the same fell from 58% to 55%.
Next we asked respondents to think about their future economic outlook and whether they believed they would be better or worse off a year from now.
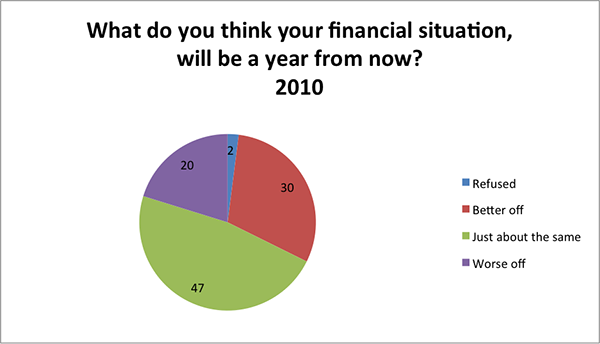
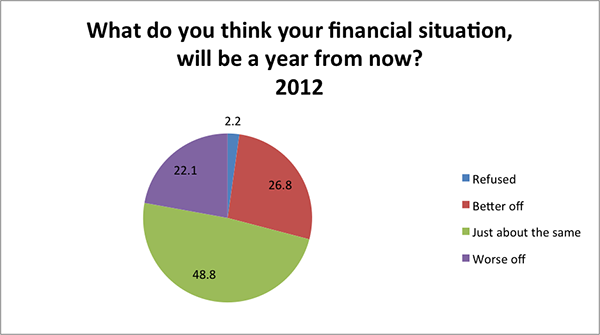
The percentage of respondents reporting that they believe they will be better off next year dropped from 30% in 2010 to 26.8% in 2012. The percentage of respondents who think they will be the same next year increased from 47% to 49%. Finally, the percentage of respondents who think they will be worse off next year increased from 20% to 22.1%. Overall, while there were increases in the percentages of respondents who believed that they were doing better than they were a year ago, there does not seem to be much optimism about the economic conditions in the coming year. Clearly, the general public reported substantial pessimism about their financial expectations for the future. Regardless, we proceed as before and also examine potential differences across race and region.
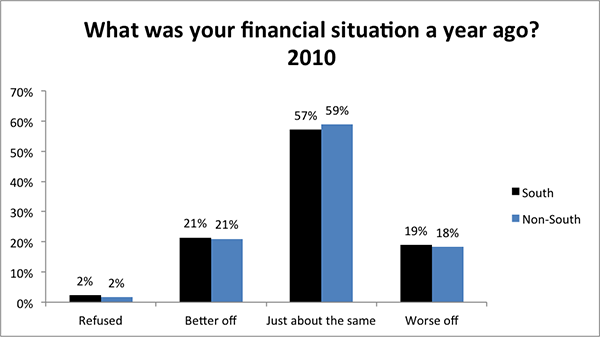
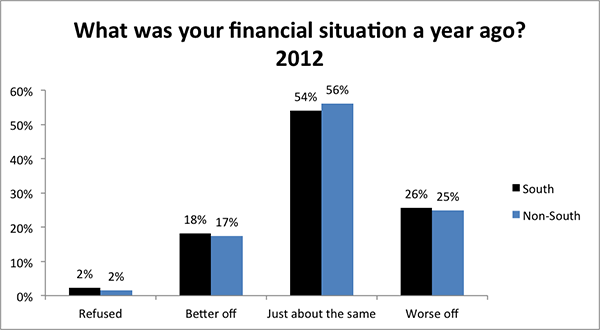
The percentage of respondents who said that they were worse off last year, or in other words, they are doing better now, increased from 19% in 2010 to 26% in 2012 in the South and from 18% to 25% in the non-South. Similar to improving unemployment rates, a greater increase in southern respondents reported being worse off in the previous year. The percentage of respondents who reported that they were better off last year, and therefore doing worse this year, fell from 21% to 18% in the South and 17% in in the non-South.
Next we look at future economic outlooks across southern and non-southern respondents.
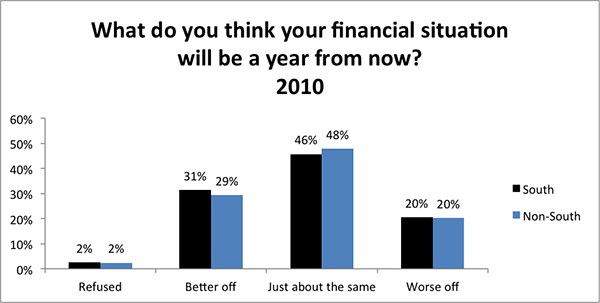
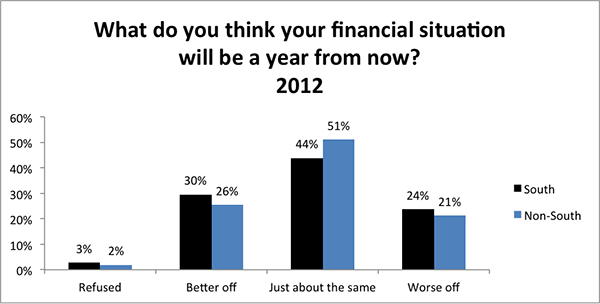
As shown in the figures above, the percentage of respondents who believe they will be doing about the same next year fell from 46% to 44% in the South but rose from 48% to 51% in the non-South. Fewer southerners think they will be about the same next year but more non-southern respondents think they will be about the same next year. The percentage of respondents who believe they will be worse off next year stayed about the same in the non-South, but in the South the percentage grew from 20% to 24%. Overall, despite the improvement in unemployment and current economic situation, the future economic outlook among southern respondents appears bleak compared to non-southern respondents.
Next, we look deeper at retrospective and prospective economic evaluations and disaggregate the data across race and region.
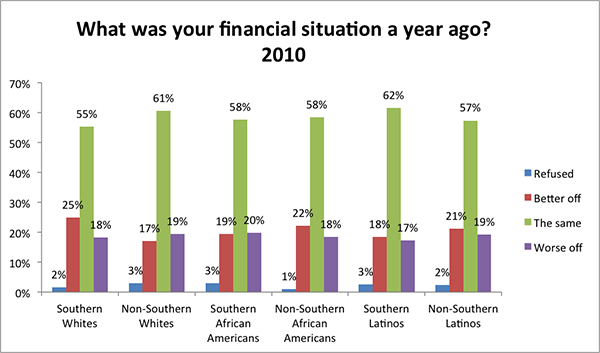
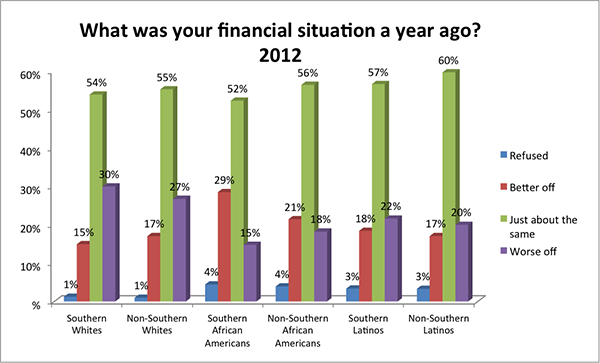
While the greatest percentages of respondents in all groups and in both years reported that they were about the same as the previous year, there were important, and opposite, changes in retrospective evaluations of southern African Americans and southern whites. The percentage of southern African Americans reporting that they were “better off” last year, meaning that they are doing worse in the current year, increased from 19% in 2010 to 29% in 2012. In other words, a greater percentage of southern African Americans were doing worse in 2012. Comparatively, however, the percentage of southern whites who reported that they were “worse off” last year, meaning that they are doing better in the current year, increased from 18% to 30%. While a greater percentage of southern African Americans reported that they were better off last year, a greater percentage of southern whites reported that they were worse off last year and doing better now. The economic downturn among southern African Americans and the economic improvement among southern whites, however, did not carry over into their hopes for the future.
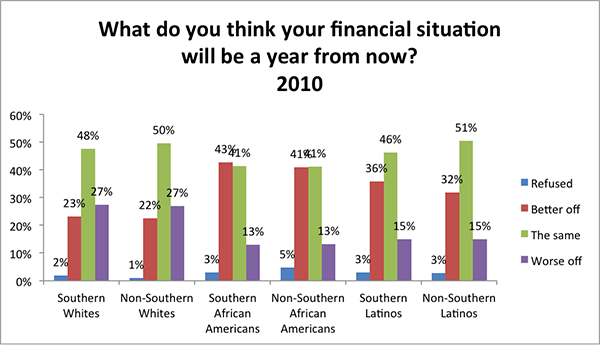
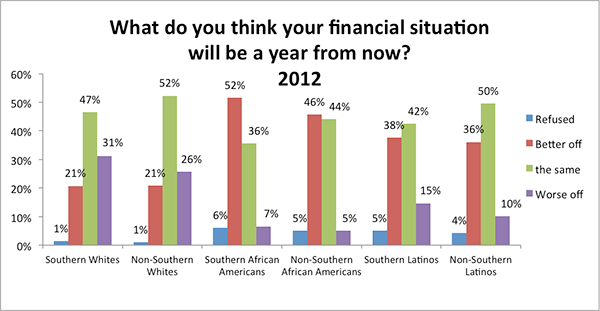
In terms of prospective economic forecasts, we again find important differences across race and region.
To the extent that negative economic situations, as well as pessimistic negative expectations, have at least in the past, resulted in backlashes against the incumbent party, the Republican Party may find itself gaining even more support among whites. While this may be true in both the South and non-South, it is particularly true among southern respondents. On the other hand, the Democratic Party may find greater support among African Americans and Latinos, particularly those who live in the South.
While observers often lament the state of the national economy, the important differences in the economic impact of a sluggish economy are often overlooked. Continued attention to the economic situations and expectations across both race and region will provide a much better gauge of party strength in the next election cycles. For example, when President Obama completes his second term, will the Democratic Party still be able to count on support from minorities who, at least currently, expect their economic situations to be improving each year? Alternatively, will minorities who currently have very positive expectations about their personal economic situation, continue to hold such positive expectations without real economic improvements, or even in the face of continued economic losses?
Almost sixty years of social science research and election year forecasting rests on the proposition that the incumbent party suffers the most at the ballot box when the economy slows. Regardless, these findings and forecasts have been conducted using data primarily from white voters. The extent to which negative retrospective evaluations work similarly among African Americans and Latinos remains to be seen. Further, the patterns that we have witnessed in both the midterm election of 2010 and the presidential election of 2012 appears that prospective economic evaluations may be more important than actual economic situations or retrospective evaluations for vote choice among both African Americans and Latinos. Whether or not these patterns will be long standing or are a short term association because of President Obama should be a central focus of future research.
Regardless, as shown in the figures above, even though the percentages of respondents who were not working and looking for work were highest among African Americans and Latinos, and these percentages did not improve much during the time between 2010 and 2012, these groups also expressed the most positive prospective evaluations. While African Americans and Latinos had the highest rates of unemployment, they also had the greatest percentages of respondents who were optimistic that they would be better off next year, and southern African Americans became even more optimistic in 2012.
Comparatively, whites had greater employment rates in both 2010 and 2012, and they expressed retrospective evaluations that were more positive than others groups. Recall that the percentage of southern whites saying their financial situation was “worse off” last year increased from 18% to 30%. There was a 12-point change in the percentage of southern whites admitting that their economic situation was worse in the previous year and that they were doing better now. That improvement, however, did not extend into the future as they were among the least positive about their economic future.
It is also important to note that these data reveal the substantial differences in the economic situations, retrospective economic evaluations and prospective economic evaluations among southern African Americans and southern whites. While southern African Americans are increasingly optimistic, southern whites are increasingly pessimistic. How these dynamics will play out over the next year as we move closer to the 2014 midterm elections will be fascinating to watch. If southern minority groups continue to remain more optimistic about their economic future, we may continue to find increasing numbers of African Americans and Latinos relocating to the South. One thing, however, is certain, the political dynamics of the southern region of the United States will continue to develop and play a central role in the future political direction of the entire country.
Methodology
The Blair Center-Clinton School Poll is a national survey that was fielded immediately following the November 2012 presidential midterm election. The BCCS Poll was administered by Knowledge Networks (www.knowledgenetworks.com), an internet based survey company that includes a representative sample of Americans in its proprietary database including representation of the roughly 30% of U.S. households that do not have internet access. In addition, it covers the growing number of cell phone only households (recently estimated at 23% of all households) through address-based sampling.
The survey probed national and regional issues of concern to the population of the United States and was conducted in both English and Spanish. The average survey took approximately 21 minutes to complete. The 2012 BCCS Pollincluded a total sample of 3,606 individuals who were at least 18 years old. The margin of error is +/-2.4. The survey contains a representative sample of each of the following groups: southern African Americans, non-southern African Americans, southern Latinos, non-southern Latinos, southern whites and non-southern whites. The margin of error for each of these groups is less than +/-2.5.