
The Impact of “Modern Sexism” on the 2016 Presidential Election
A report from the 2016 Blair Center Poll prepared by Angie Maxwell, Ph.D. and Todd Shields, Ph.D.
Historical Context
On June 6, 2016, Hillary Clinton became the first woman to earn a majority of pledged delegates to secure a major party’s presidential nomination. The pledged votes, along with those of the super-delegates, would be cast officially seven weeks later at the Democratic National Convention. Along with Jill Stein, the 2012 and 2016 Green Party nominee, Clinton, then joined, for the second time, a list of 45 women who have vied for the presidency since Victoria Woodhull ran in 1872 representing the Equal Rights Party.[1] Some simply had their names put into nomination at their respective conventions, while others actively campaigned. Most competed as third-party candidates. Other than Clinton herself in 2008, Congresswoman Shirley Chisolm forged the deepest inroads, winning 152 (5%) delegates at the 1972 Democratic National Convention, nearly a half-century ago. Despite the historic nature of the nomination, the impact that Clinton’s (or Stein’s) gender might have on the outcome of the election, warranted minimal attention.
Perhaps this is because resistance to the abstract idea of a female president often centers on the notion of a woman Commander-in-Chief. Clinton’s ability to overcome that stereotype via, most notably, her experience as Secretary of State, was best represented by the sheer number of U.S. military leaders who appeared at the convention in support of her candidacy. Her success in that regard, however, quieted much of the debate about gender and electoral politics.
National polling also seemed to indicate that such stereotypes has dissipated. Support for a female president has been measured by Gallup and Pew for decades. Gallup first posed the question in 1937 showing only 1/3 of Americans polled supporting the notion. That number reached 87% in 2003, with over 90% of younger voters indicating they would vote for a female presidential candidate.[2] Pew’s 2007 poll found support remained at 87%, up from 53% when they debuted the question in 1969.[3]
Though seemingly encouraging, these numbers seem at odds with the four-decade gap between Chisholm’s breakthrough and Clinton’s nomination. Though the increase in polled acceptance of a hypothetical female president may be incremental, female presidential candidates have been absent from serious consideration for much of that time. Does Clinton’s successful nomination denote a post-sexist political environment, reflecting a steady change in attitudes over the years? Is her successful nomination a watershed moment in the Democratic Party specifically, or is it an anomaly? Moreover, what impact did her gender have on her chances—or the chances of any female candidates—in a general election?
Less than three years ago, in a 2014 poll, Pew also asked 1,000 American men and women if they hoped to see a female president in their lifetime, and the results exposed a partisan difference. While 69% of Democratic women said yes, only 45% of Independent women, and only 20% of Republican women agreed. The numbers are even worse among men. Less than half (46%) of Democratic men hoped to see a female president in their lifetime, as well as just under 1/3 of Independent men (32%) and only 16% of Republican men.[4] Moreover, in October 2015, the Roper Center at Cornell University, took a deeper look into such hypothetical polling, inquiring as to whether American voters were comfortable or, perhaps, even enthusiastic about voting for a female president. While a majority (54%) said they were “comfortable,” only 28% were “enthusiastic.” Another 10% had “some reservations,” and 4% reported being “very uncomfortable” with the idea.[5]
However, lack of enthusiasm for a female candidate, even if it is partisan, is only one side of the coin; animosity is the other. In the spring of 2008, Matthew Streb, Barbara Burrell, Brian Frederick and Michael Genovese found that social desirability seems to be skewing the overwhelming majorities found by Gallup and Pew. Using a list experiment—a technique used in psychology—the researchers found that 26% of the population actually expressed anger or upset feelings in response to a female president, suggesting that support is highly exaggerated.[6] Anger jumps significantly among people who live in the South to almost 1/3 of the population.
That study raises two important points. First, the finding regarding the South speaks to a longstanding regional distinctiveness related to gender roles. Southern whites, specifically, cultivated traditional gender roles as a false justification for white supremacy and segregation, claiming white women needed protection from African American men. These traditional gender roles—also enforced for many by religious beliefs—have a long-term effect on political culture in the region. Though research is scant on the subject, Leonie Huddy and Nayda Terkildsen, in their analysis of southern elections, for example, find that the level of office to which the candidate aspires is relevant to the potential for voters to support a woman. Male traits—such as aggression—are preferred by people who live in the South when evaluating candidates for national offices, but female traits are deemed acceptable only for lower-level compassion-based county and state positions.[7] Similarly, David Lublin and Sara E. Brewer found that women in the South are successful primarily when running for less-desirable state and local offices.[8]
Second, the significance of social desirability in the study indicates that while the public climate has changed, personal attitudes may not have. A similar disconnect was measured regarding American racial attitudes in the decades following the Civil Rights Movement. Social science scales, most notably the “Old-Fashioned Racism” or “Racial Stereotypes” measures indicated that white Americans were reporting less racist answers in their assessments of the work ethic, intelligence, and trustworthiness of African Americans. However, modern measures of racism (“Symbolic Racism” or “Racial Resentment”) were developed which revealed that though many white Americans would no longer admit publicly that they believed African Americans as a group to be deficient in these stereotypical characteristics, they harbored high levels of resentment towards them as a community.
Similarly, social scientists in the past utilized the “Attitudes Towards Women” scale which also measured belief in stereotypical characterizations regarding the inferiority of women, particularly in terms of work and/or public life.[9] Though a more politically correct culture has developed in the decades since the Women’s Liberation and Feminist Movements of the 1970s, it may mask high levels of resentment towards women in the workplace or seeking public office.
In 1995, Janet K. Swim, Kathryn J. Aikin, Wayne Hall, and Barbara Hunter introduced a scale that can shed light on such questions. Their scale, called “Modern Sexism,” seeks to uncover whether the respondent believes in the ongoing discrimination against women, expresses hostility towards women’s push for equality, resents efforts made to help women overcome past discrimination, and/or resents women themselves for being too quick to cry sexism and too quick to ask for favors based on their gender.[10]
Finally, it is important to note that “Modern Sexism” should not be solely measured among men, but among women too. In a 1988 article in the Journal of Politics, Pamela Johnston Conover, rather than compare political leanings between men and women, examined the differences between women who identified as a feminist and those who did not. She found that feminist identity was second only to party identification in terms of its influence on policy attitudes. And she concludes with this statement: “there is not so much a gap between men and women as there is a gap between men and feminist women.”[11] Only three years later, Elizabeth Cook and Clyde Wilcox examined not just feminist women, but also “feminist” men.[12] Though they are fewer in number, their “feminism” was found to be equally influential on their political attitudes as well.
Based on this scholarship, in 2012, the Blair Center Poll began asking all respondents five questions from the “Modern Sexism” scale, in an effort to gage the persistence of such attitudes and to examine, specifically, if attitudes in the South remained distinct. Four years later, the Clinton nomination in the 2016 presidential race provided an opportunity to consider not only if such resentment still exists, but also what kind of impact it had on a female contender.
Data and Methodology
The 2016 Blair Center Poll is a national survey fielded immediately following the presidential election. The 2016 Blair Center Poll was administered by GfK Group (formerly Knowledge Networks),[13] an internet-based survey company with a representative sample of Americans in its proprietary database. Their sample also includes representation from U.S. households that do not have internet access. In addition, it covers the growing number of cell phone only households through address-based sampling. GfK uses an Address Based Sampling (ABS) methodology via the Delivery Sequence File (DSF) of the USPS for recruiting participants. This is a probability-based sampling methodology that improves the representation of the population and increases the participation of sub-populations that otherwise might be difficult to reach, such as individuals living in rural areas or minority groups. Importantly, participants who do not have access to the internet are provided with a web-enabled device and free Internet service. In 2008, the creation of the KnowledgePanel LatinoSM gave scholars the opportunity to survey Hispanic/Latino(a)s living in the United States. The KnowledgePanel Latino, an online panel representative of Hispanics also includes individuals who do not have access to the internet as well as those individuals who only speak Spanish.
The survey probed national and regional issues of concern to the population of the United States and was conducted in both English and Spanish. The average survey took approximately 16 minutes to complete. The 2016 Blair Center Poll included a total sample of 3,668 individuals who were at least 18 years old. The margin of error for the entire sample is +/-2.4. Of the sample, 1, 732 respondents were non-Latino, white, 1,021 respondents were Latina/o, and 915 were African American. The sample also included 1,828 participants living in the geographic South, defined here as the 11 states of the former Confederacy. Thus, the survey contains a representative sample of each of the following groups: southern African Americans, non-southern African Americans, southern Latinos, non-southern Latinos, southern whites and non-southern whites. The margin of error for each of these groups is less than +/-2.5. The data is weighted to reflect national demographics. Variables are defined in the appendix.
Findings: Modern Sexism Levels and Demographics
In an effort to assess the levels of “Modern Sexism” among Americans, the 2016 Blair Center Poll presented five statements to respondents to which they indicated their level of agreement. These questions read as follows:
- Many women are actually seeking special favors, such as hiring policies that favor them over men, under the guise of asking for “equality.”
- Most women interpret innocent remarks or acts as being sexist.
- Feminists are seeking for women to have more power than men.
- When women lose to men in a fair competition, they typically complain about being discriminated against.
- Discrimination against women is no longer a problem in the United States.
The alpha for the scale was .86. Responses were measured on a 5-point Likert scale from “strongly disagree,” “disagree,” “neither/neutral,” “agree,” or “strongly agree.” Depending on their answers, respondents held a cumulative Modern Sexism score ranging from 5 to 25. Giving a “strongly disagree” answer to all five statements resulted in the minimum score of 5, whereas a “strongly agree” answer on all five questions resulted in the maximum score of 25. Answering “neutral” to all five statements resulted in a score of 15. Thus, any score over 15 indicates that the respondent holds some cumulative level of Modern Sexism, while any cumulative score under 15 indicates a general lack of Modern Sexism.
Respondents were then classified as “sexist,” “neutral,” or “non-sexist” based on where their overall Modern Sexism score fell on the scale of 5-25 points. Figures 1a, 1b, 1c, and 1d illustrate what percentage of each sub-group of the American population falls into each of these categories. As shown in Figure 1a, among the entire national sample, almost half of the respondents (47.1%) fell into the non-sexist category, while 16.7% had an overall Modern Sexism score of 15, making them “neutral.” And 36.2% of the national sample reported holding “Modern Sexist” attitudes, with overall scores above 15.
Figure 1a: Modern Sexism Scores by Race, Party ID, and Region, ALL Respondents
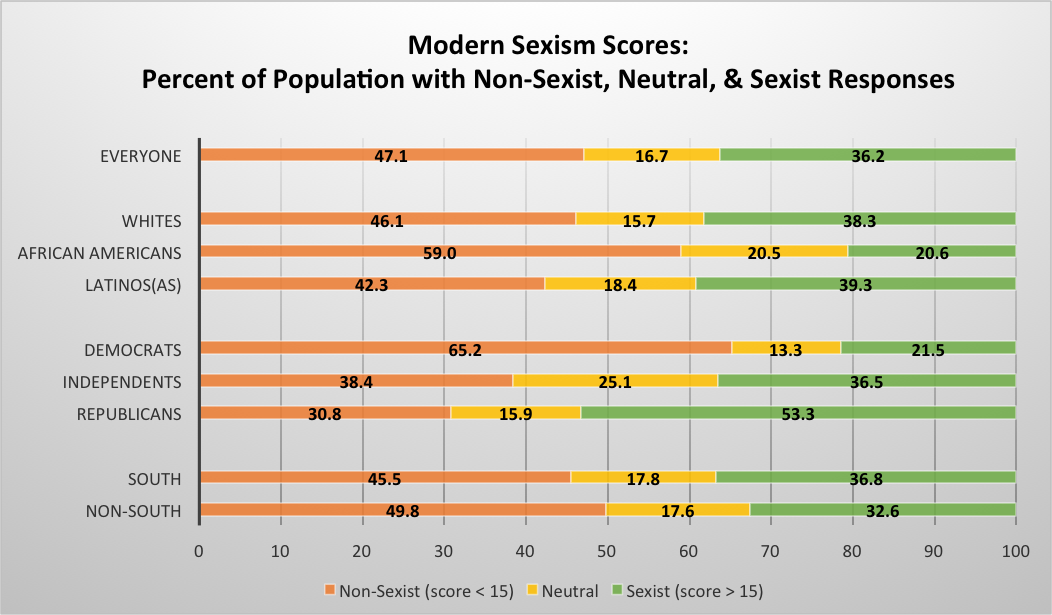
Figure 1a: Modern Sexism Scores by Race, Party ID, and Region, ALL Respondents
Among three major racial groups, African Americans had the largest group of “non-sexists,” at 59% of their sample, compared to 46.1% of “non-sexist” whites and 42.3% of “non-sexist” Latinos. African Americans also had the smallest percentage (20.6%) of their sub-group fall into the “sexist” category. The percentages of whites and Latinos(as) receiving “sexist” scores were almost identical at 38.3% and 39.3% respectively.
In terms of party identification, Democrats were decidedly less “sexist” with only 21.5% of their community with scores over 15, compared to 36.5% of Independents. However, the majority (53.3%) of Americans who describe themselves as Republicans had an overall “sexist” score. Geographical distinctions, when all races are considered, remain, with a 4 to 5-point gap between respondents who live in the South and respondents who live outside of the South in the “non-sexist” and “sexist” categories.
“Modern Sexist” attitudes, as previously mentioned, are not exclusive to men. Figures 1b and 1c provide a gender breakdown among the same racial, geographical, and party identification sub-groups. Overall, there is a 10-point gender gap among Americans who report “sexist” attitudes—41.8% of men compared to 31% of women. Rates of “sexism” are highest among white men (44.2%), followed closely by Latino men (42.3%), but only 26.1% of African American men fall into this category. Among women, the largest percentage of “sexists” is among Latinas (36.3%), with white women a close second at 32.6%. The lowest percentage of “sexists” is among female African Americans (16.1%).
In terms of party identification, 27% of males who self-identify as Democrats are “sexists,” but that number jumps to 41.6% among Independent men and more than doubles among Republican men (56.3%). Women follow a similar pattern, with 17.2% of Democrats and 31.4% of Independents being categorized as “sexist.” Almost half, however, of Republican women (49.9%) reported “sexist” attitudes as measured by the Modern Sexism scale.
Figure 1b: Modern Sexism Scores by Race, Party ID, and Region, MEN only

Figure 1b: Modern Sexism Scores by Race, Party ID, and Region, MEN only
Such gaps based on party identification highlight a major difference in attitudes between Republicans and Democrats when it comes to women in the workplace, with roughly 30-point gaps between both males and females based on their partisan affiliation.
Figure 1c: Modern Sexism Scores by Race, Party ID, and Region, WOMEN only

Figure 1c: Modern Sexism Scores by Race, Party ID, and Region, WOMEN only
Regional differences among all respondents are minimal but persistent. There is a four-point gap between the percentage of “sexist” men who live in the South (42%) and men who live outside of the South (38%), and less than a five-point gap between the percentage of “sexist” women who live in the South (32%) and women who live outside of the South (27.6%). Women who live outside of the South have the largest percentage of “non-sexists” at 55.4%, more than a six-point gap over “non-sexist” women who live in the South (49.2%), and a double-digit gap over both the percentage of “non-sexist” men who live in the South (41.4%) and who live outside of the South (43.8%).
However, since the research regarding southern distinctiveness and the intersection of gender roles and political attitudes pertains primarily to southern whites, Figure 1d provides additional comparisons among white Americans. The 2016 Blair Center Poll contains two different measures for “South” or “southern.” The first is the basic geographic designation—“South”—which includes the 11 states of the former Confederacy, while the other—“southern”—is based on respondents’ answers to whether or not they identify as a southerner. As in-migration to the region increases, data from the Blair polls has repeatedly revealed that the identity designation lies at the heart of distinctiveness. This major finding is being explored more thoroughly in the authors’ forthcoming book The Long Southern Strategy (Oxford University Press, Fall 2018).
As Figure 1d reveals in more detail, there is a 10-point gap between the percentage of “sexist” whites who live in the South (40.8%) and “sexist” whites who identify as southern (50.2%). That gap holds firm for white men and white women as well. Of all of the sub-groups examined, white men who identify as southern have the second highest percentage of “sexists,” at 55.9%, second only to Republican men (for whom they are also a large contingency) at 56.3%. Republican women, as a whole, come in third at (49.9%), and white women who identify as southern come in fourth at 45.4%. This means that there is a larger percentage of Republican women and white women who identify as southern who have “sexist” scores on the Modern Sexism scale, than all of the remaining sub-groups of men, which is another reminder that these attitudes are not based on gender distinctiveness, but are shared by men and women alike.
Figure 1d: Modern Sexism Scores by Region, Identity, and Gender, WHITE Respondents
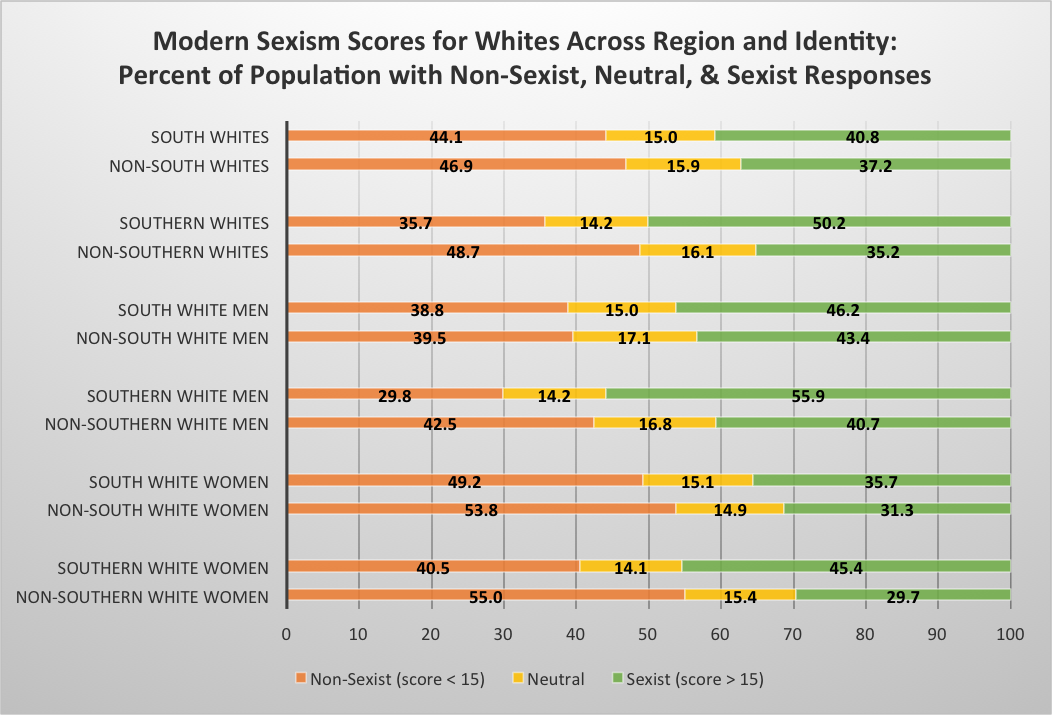
Figure 1d: Modern Sexism Scores by Region, Identity, and Gender, WHITE Respondents
Figure 1d also speaks to the power of the southern identity label as division between white American women. There is a 15-point gap in the percentage of “sexists” between white women who identify as southern (45.4%) and those who do not (29.7%), though that number is still relatively high compared to African American men and women.
Findings: Modern Sexism and the 2016 Election
The high percentage of Americans who either deny ongoing discrimination against women, react negatively towards “feminism,” or negatively characterize women as prone to complaining, wanting special treatment, or being too sensitive to sexism, might account for the lack of enthusiasm towards a female presidential candidate. The pervasiveness of these attitudes coupled with the significant variation in Modern Sexism scores among Democrats, Independents, and Republicans, suggests that Modern Sexism did influence the 2016 presidential election for many Americans.
In order to assess that impact, even within a political party, Figure 2 provides the percent of the main Democratic and Republican primary/caucus candidates’ supporters who are classified as “sexists” per the Modern Sexism scale. Among the two leading Democratic candidates, Bernie Sanders’ primary/caucus voters included the lowest percentage of “sexists” (16.3%) compared to 19.5% of Clinton’s voters, and both are significantly lower than the levels found among most of the Republican contenders. Only three Republican primary/caucus candidates had less than half of their supporters with “sexist” attitudes. Nearly one-third of respondents (31.2%) who cast their vote for John Kasich fell into the “sexist” category, compared to 46.3% of Jeb Bush’s voters, and primary/caucus voters for Marco Rubio were three-tenths shy (49.7%) of a “sexist” majority. The other three major Republican contenders, Ben Carson, Donald Trump, and Ted Cruz, had levels of “sexist” supporters nearly three times that of Democratic primary/caucus voters, with 56.5%, 58%, and 65.4% of their voters holding these attitudes, respectively.
Figure 2: Percent of Primary Voters with “Sexist” Responses by Candidate

Figure 2: Percent of Primary Voters with “Sexist” Responses by Candidate
There was an “other” category, for those who chose a minor candidate in their primary/caucus, though, unfortunately, it is not party specific.
With such massive Modern Sexism gaps not only between Democrats and Republicans, but also among primary/caucus candidate voters within the GOP, unifying the party around the successful nominee could have been difficult—particularly if “non-sexists,” for example, hesitated to support a candidate with such a “sexist” base. However, despite these gaps, Republicans did, indeed, come together to support the party’s nominee, and eventual victor, Donald Trump. Even though only 58.8% of those surveyed by the 2016 Blair Center Poll and who participated in the GOP primary/caucus elections reported voting for Trump in the primary/caucus, 84.4% of all respondents who participated in the Republican primary/caucus election ended up casting their vote for Trump in the general election, a remarkable feat considering how many GOP options there were.
Figure 3 provides a breakdown of how those who participated in the Republican primary/caucus voted in the general election. Of the 15.6% of GOP primary/caucus voters who did not coalesce behind their party’s nominee, 6.6% voted for Clinton, 4.3% voted for Johnson, and 3.6% wrote-in a candidate. The remaining voters cast their ballots for Jill Stein (0.5%) or stayed home (0.6%). The legend also denotes the mean Modern Sexism scores for these voters. The 84.4% of GOP primary/caucus participants who voted for Trump in the general election had the highest average Modern Sexism score of 16.8, meaning the whole group on average fell into the “sexist” category, as did Johnson’s supporters (15.8), those who wrote in a candidate (15.6), and those who stayed home (15.2). Together these four groups—all with a mean “sexist” score—comprise 92.9% of the GOP primary/caucus voters. Only those GOP primary/caucus voters who voted for Stein and Clinton had mean Modern Sexism scores in the “non-sexist” range at 12.5 and 12.9 respectively.
Figure 3: General Election Vote Choice of GOP Primary Voters: Percent by Candidate with Mean Modern Sexism Score
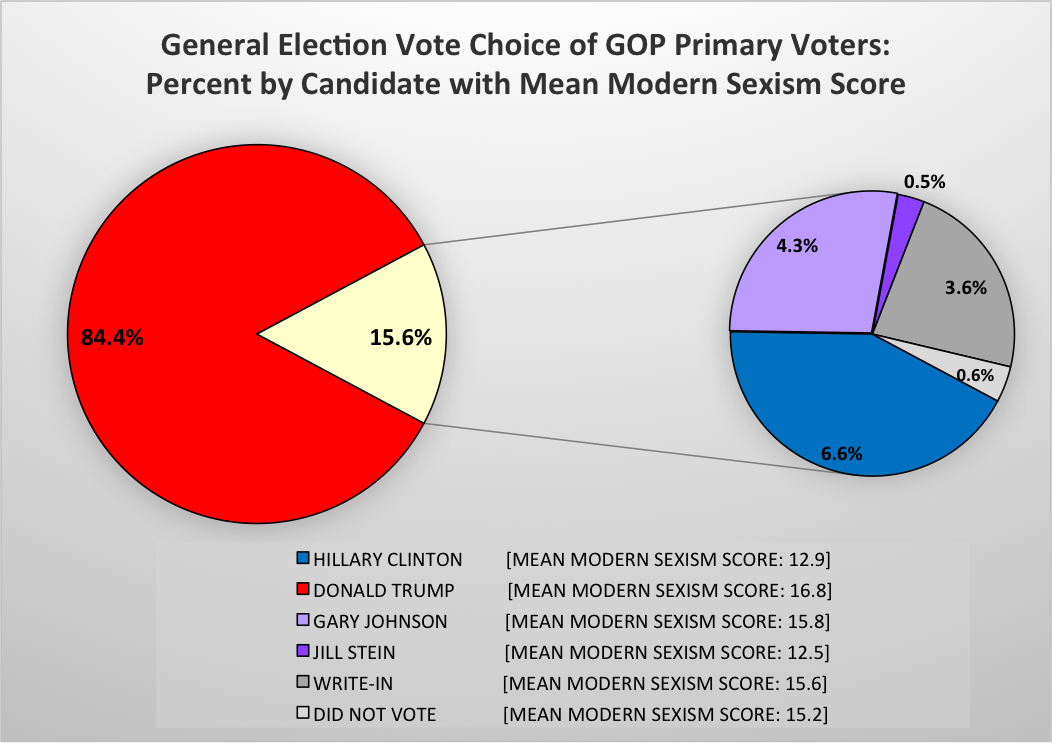
Figure 3: General Election Vote Choice of GOP Primary Voters: Percent by Candidate with Mean Modern Sexism Score
Democrats were not as successful at forging a general election coalition. Only 74.4% of Sanders’ primary/caucus voters reported voting for Clinton in the general election. The 25.6% of Sanders’ primary/caucus voter who did not vote for Clinton in the general election translates into an approximately 2.8% decrease in Clinton’s popular vote total in the general election. Figure 4 provides a breakdown of who Sanders’ supporters ultimately chose.
Over 15% of Sanders’ supporters voted outside of the two major parties, with 7% choosing Johnson, 4.6% choosing Stein, and 4% submitting a write-in candidate. Another 4.1% decided not to vote at all, and 5.9% crossed the partisan divide and cast their vote for Trump.
Figure 4: General Election Vote Choice of Sanders’ Primary Supporters: Percent by Candidate with Mean Modern Sexism Score
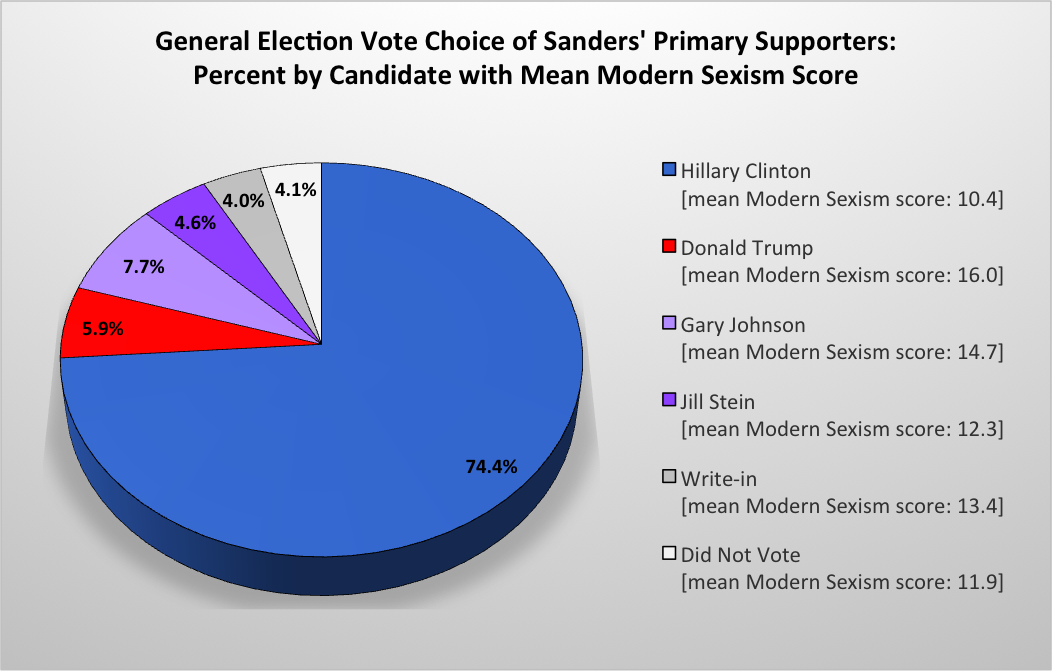
Figure 4: General Election Vote Choice of Sanders’ Primary Supporters: Percent by Candidate with Mean Modern Sexism Score
Though the percentage of Sanders’ “sexist” supporters was the lowest measured, they were also the only group of voters who, if they wanted to vote for the nominee of the party with which they participated during the primary/caucus election, had to vote for a woman. Thus, Figure 5 also includes the mean Modern Sexism score of Sanders’ supporters by general election candidate choice. On average, the least “sexist” Sanders’ supporters did vote for Clinton. Those slightly higher on the scale either did not vote or voted for Stein. On average, Sanders’ primary/caucus voters who had Modern Sexism scores closer to “neutral” either wrote-in their own candidate or selected Johnson. Sanders’ supporters with decidedly “sexist” attitudes voted for Trump.
A logit model provides a closer look at Sanders’ primary/caucus voters who did not support Clinton in the general election (see appendix for full model). Including demographic measures such as age, education level, income, marital status, region, gender, race, and employment, as well as attitudinal measures such as party identification, ideology, biblical literalism, Racial Resentment, and Modern Sexism, only four variables significantly predicted who among Sanders’ primary/caucus voters would choose Clinton in the general election. Age and income were negative and significant, and party identification and Modern Sexism were positive and highly significant, meaning that younger voters and those with less income were significant less likely to vote for Clinton, after voting for Sanders in the primary/caucus. And the farther away a Sanders voter considers themselves from the Democratic Party and the more “sexist” a Sanders supporter becomes along the Modern Sexism scale, the less likely they were to vote for Clinton.
Clearly, “Modern Sexist” attitudes played a role in the general election. An examination of the Modern Sexism levels of ALL general election voters is shown in Figure 6. Only 15.9% of Stein voters and 17.2% of Clinton voters fell into the “sexist” category by virtue of their overall Modern Sexism score. The percent of “sexist” voters is nearly three times that high for Johnson (44.4%) and nearly four times higher for Trump (57.7%).
Figure 5: Percent of General Election Voters with “Sexist” Responses by Candidate
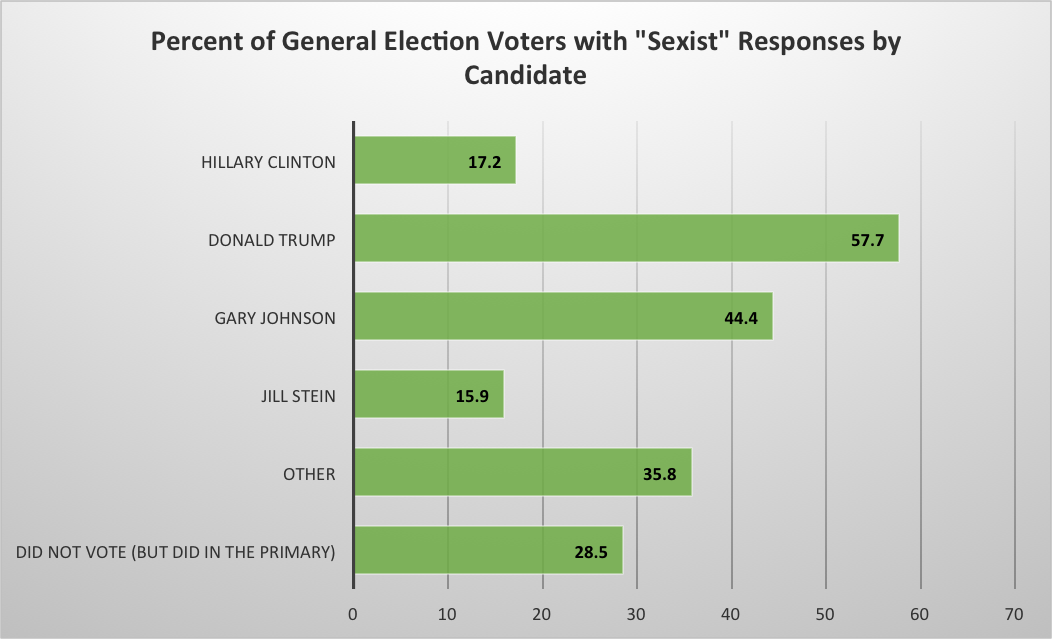
Figure 5: Percent of General Election Voters with “Sexist” Responses by Candidate
Finally, in order to determine whether Modern Sexism scores significantly affected the likelihood that an average voter would choose a female candidate, logit models were estimated, the results of which are presented in Tables 1a, 1b, 1c, and 1d. The models predict voting for either Jill Stein or Hillary Clinton in the 2016 general election (see appendix for full models). The first column in the table lists the percentage of each group who voted for Stein. Her vote is negligible (less than 1%) for all groups except Latinos(as), Independents, and respondents who live outside of the South, from whom she received less than 2% each. Thus, the bulk of what the model is predicting is vote for Clinton.
Again, the models controlled for a host of measures, including standard demographic variables such as gender, race, income, age, marital status, unemployment, and education level, as well as attitudinal variables such as party identification, ideology, biblical literalism, Racial Resentment, and, of course, Modern Sexism. The variables are listed across the columns of each table. The models were estimated among the groups considered in Figures 1a, 1b, 1c, and 1d, who are listed down the rows of the table.
Holding all variables constant, any variable that was a statistically significant predictor of voting for a female candidate is indicated by a check mark. The number of checkmarks correspond to the significance level of that variable. A single check mark indicates the variable was significant to the 0.10 degree; two check marks=0.05; three check marks = 0.01, and four check marks = 0.001. If a variable is significant to the 0.001 degree ( üüüü) this indicates that a relationship this strong would only occur by chance 1 time out of 1,000. In other words, the statistical relationship is not random. The (+) or (-) signs indicate whether the variable had a positive (more likely) or negative (less likely) impact on voting for Clinton or Stein.
As shown in Table 1a, party identification and/or ideology, as well as race, are almost always significant, and these models are no exception. Being more Republican makes you less likely to support a female candidate among every single sub-group. For Republicans, biblical literalism is slightly significant and also makes one less likely to vote for a female candidate. Racial Resentment plays a powerful role too, proving to be highly significant among every sub-group except for African Americans, Latinos(as), and Democrats.
It is important to note as well, that age is not significant for any group of Americans, except Democrats, which means that young people as a whole are not significantly more likely to vote for a woman just based on their age. And in fact, in the case of Democrats, increased age is positively related to voting for one of the 2016 female candidates. Education also fails to move the needle as well, except among Latinos, indicating that two popular assumptions—that younger generations and more educated voters—would be less resistant to voting for a female candidate for the White House are false in this election cycle.
Overall, women were more likely to vote for a female president in this election. In the sub-groups, gender, as well as income, is positive and significant among whites, Democrats, and those who live outside of the South. Perhaps most importantly, Modern Sexism is highly significant in every group except African Americans. It is slightly less significant among Latinos(as), but still remains at the .05 level. In every case the impact is negative, with higher Modern Sexism scores making respondents less likely to vote for Clinton or Stein.
The final column in Table 1a (as well as in Table 1b, Table 1c, and Table 1d) provides the predicted probability of voting for a female candidate generated for each group based on the logit models. The predicted probability shows even more clearly the relationship between Modern Sexism and voting for a female candidate in the 2016 presidential election—when all of the other variables are held constant at their mean values. The column indicates the predicted probability of the average respondent in each group—IF “Modern Sexism” was a significant variable for that group—voting for a female candidate in the 2016 presidential election at the lowest point on the Modern Sexism scale and at the highest point on the Modern Sexism scale. The range, thus, shows how much the likelihood of the average respondent voting for a female candidate moves as he/she becomes more “sexist,” knowing that Modern Sexism is statistically significant for that group.
In Table 1a, if the average Republican holds the lowest Modern Sexism score of 5, there is a 73% chance that they will vote for a woman for President; however, if they have the highest score of 25, that likelihood plummets to 11%. Independents, on the other hand, have a 96% likelihood of voting for a female president with a Modern Sexism score of 5, and even when the average Independent has the highest score of 25, that likelihood only drops to 55%. Thus, despite the highest level of Modern Sexism recorded, the average Independent, holding all other variables constant, is still likely to vote for a female. On the other hand, the average white American, at the lowest point on the scale, has a 78% chance of voting for a woman president, but that chance drops to 13% at the high point of the Modern Sexism scale.
Table 1a: Logit Models Predicting Vote for a Female Candidate in the 2016 Election—ALL Respondents
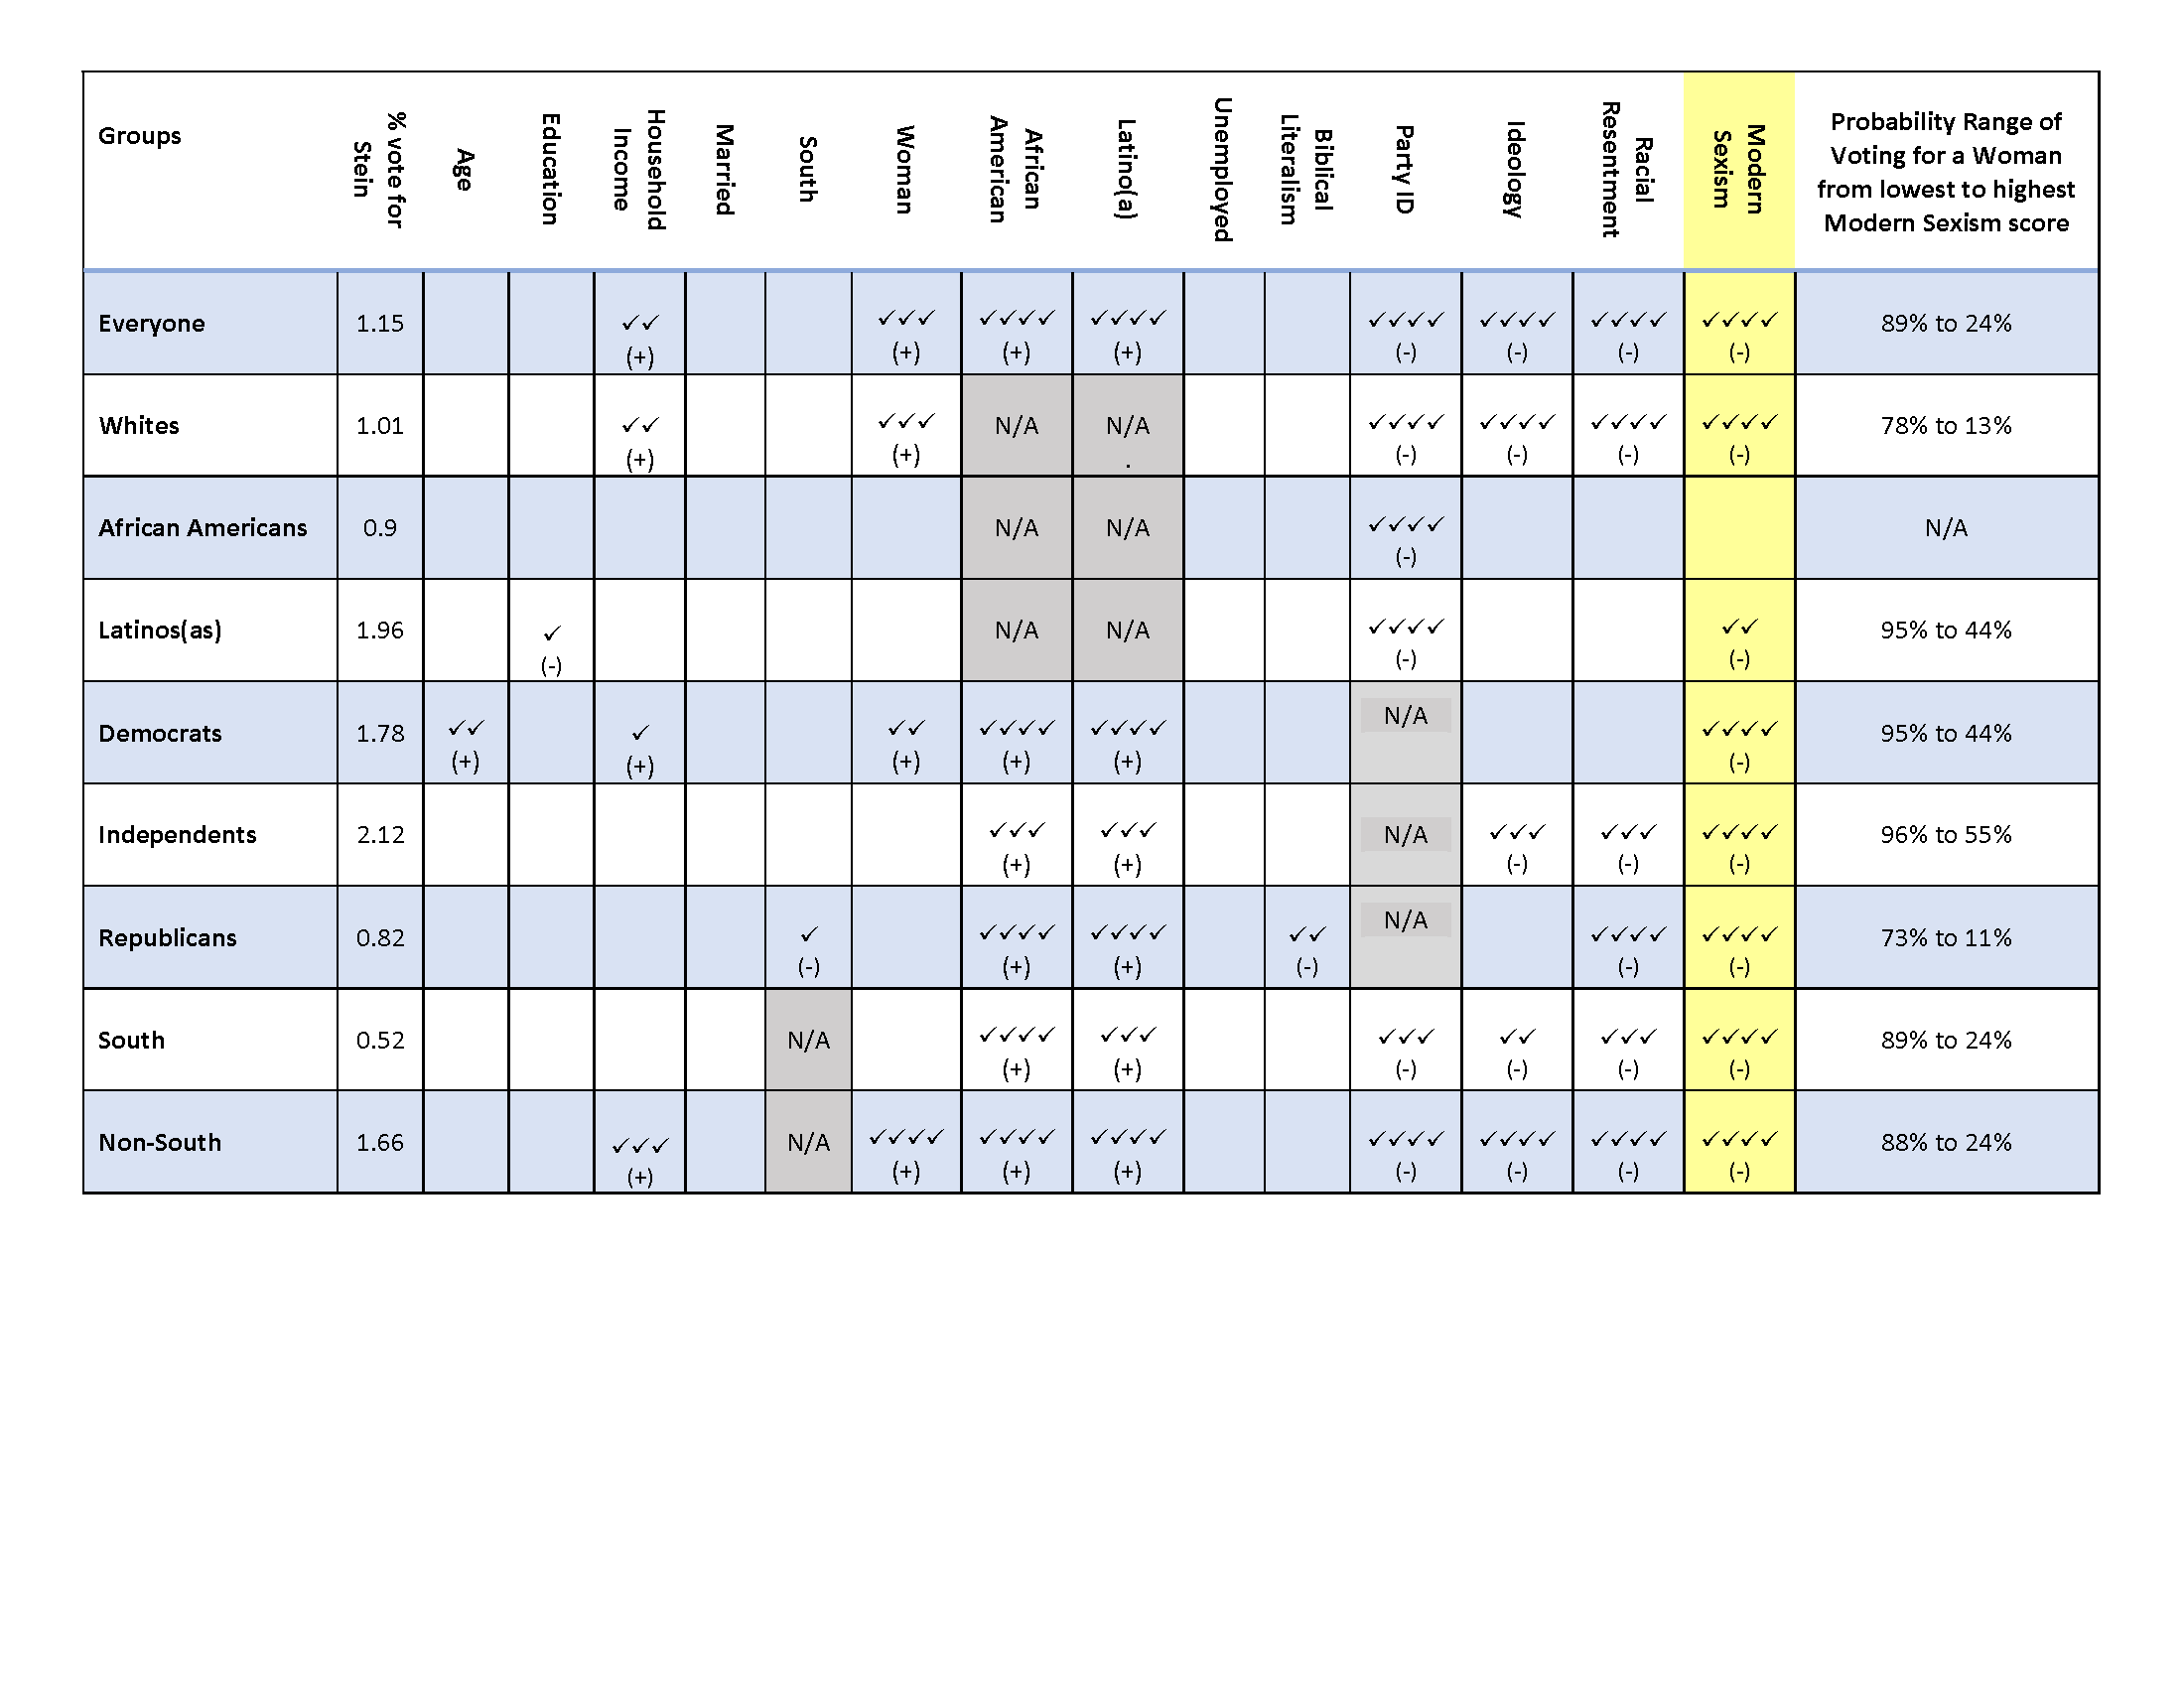
Table 1a: Logit Models Predicting Vote for a Female Candidate in the 2016 Election—ALL Respondents
Table 1b and Table 1c report the results of the models by gender. Among American men, Stein received more than 1% of the vote share from African American men, Latino men, and Democratic men, and topped 2% among Independent men. Racial Resentment has a significant and negative impact on the likelihood of voting for a woman among all men, but only among the subgroups of Republican men, white men, and men who live in the South. Party identification follows the same pattern as it held among all respondents, with every group being less likely to vote for a female candidate the more Republican they are.
Modern Sexism too is significant for every subgroup except African American men. When looking at white men, for whom Modern Sexism is highly significant, the power of the measure is undisputable. The average white man holding the lowest possible score of 5 has a 75% chance of voting for Stein or Clinton, but at the high score of 25, those chances drop to 12%. Among Republican men the drop is just as steep, from a 69% chance to a 10% chance.Table 1b and Table 1c report the results of the models by gender. Among American men, Stein received more than 1% of the vote share from African American men, Latino men, and Democratic men, and topped 2% among Independent men. Racial Resentment has a significant and negative impact on the likelihood of voting for a woman among all men, but only among the subgroups of Republican men, white men, and men who live in the South. Party identification follows the same pattern as it held among all respondents, with every group being less likely to vote for a female candidate the more Republican they are.
Table 1b: Logit Models Predicting Vote for a Female Candidate in the 2016 Election—MEN only
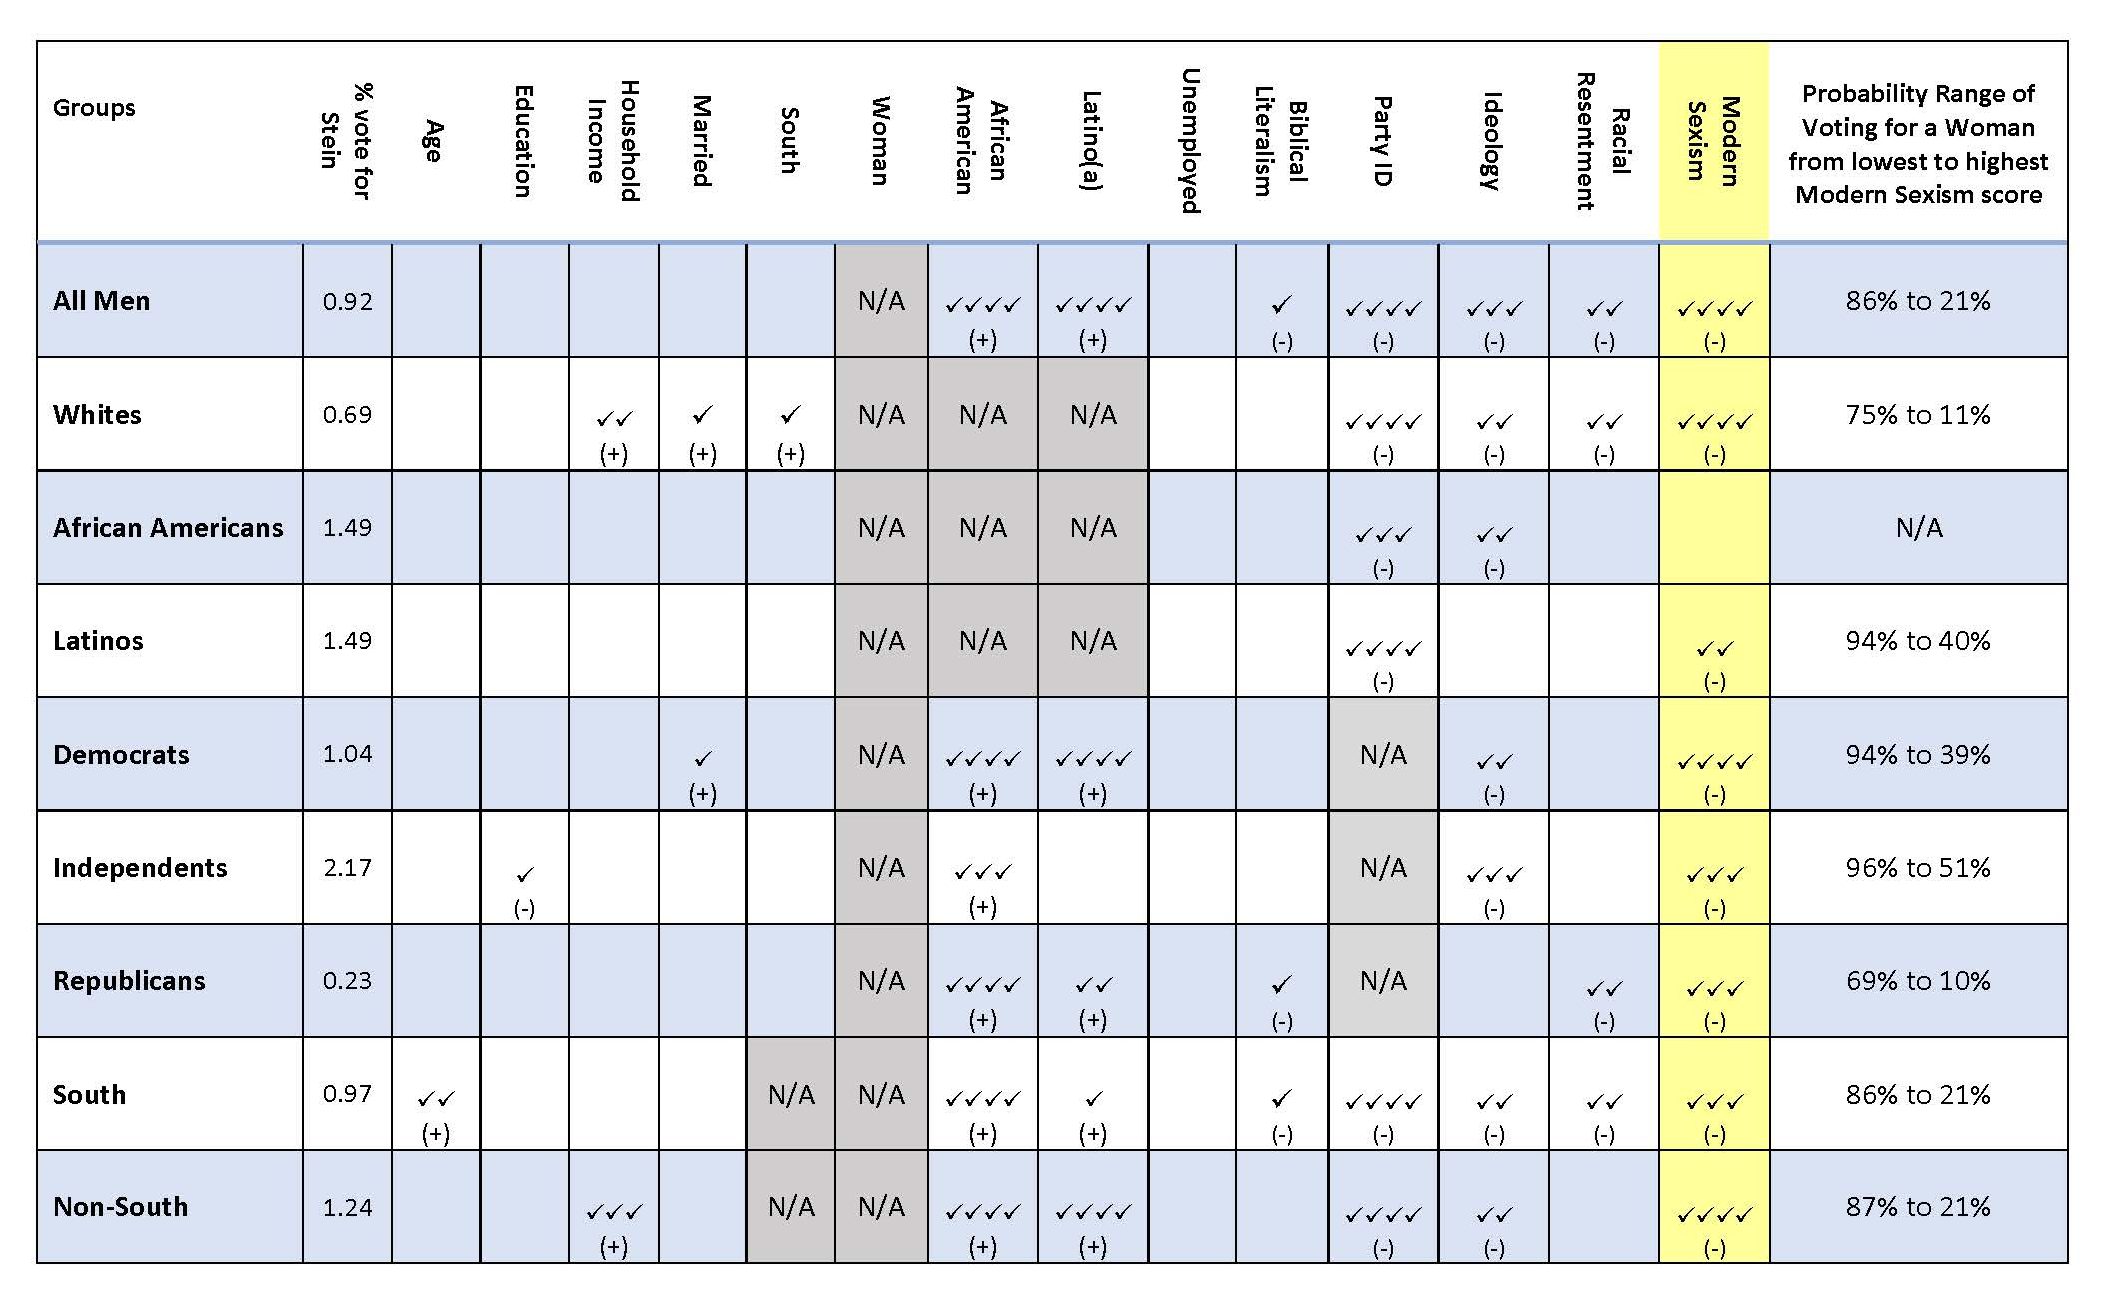
Table 1b: Logit Models Predicting Vote for a Female Candidate in the 2016 Election—MEN only
Table 1c: Logit Models Predicting Vote for a Female Candidate in the 2016 Election—WOMEN only

Table 1c: Logit Models Predicting Vote for a Female Candidate in the 2016 Election—WOMEN only
Among women, as shown in Table 1c, vote for Jill Stein broke the 1% mark among all women—and specifically among white women, Democrats, and Republicans—and the 2% mark with Latinas and Independents. Party identification is, predictably, highly significant among all sub-groups, with more strongly identifying as a Republican making respondents less likely to vote for either of the women candidates. Older women Democrats and older women who do not live in the South, are more likely to vote for a female president in 2016, while younger Republican women are less likely to do so. Achieving higher education levels makes white women and non-southern women more likely to cast their ballots for a woman, and higher incomes make Latinas more likely to vote for a female candidate. Being married has a divergent effect on Democratic women who are less likely, and Republican women, who are more likely to then vote for Clinton or Stein, except if those Republican women live in the South which negatively impacts their choice. Racial Resentment is highly significant among all sub-groups of American women except for African Americans, of course, and Latinas, who are also the only groups of women for whom Modern Sexism is not significant.
It is perhaps most important to note that “Modern Sexist” attitudes—these beliefs that women are too quick to complain about sexual harassment, women want special favors for being women in the workplace, that feminists are not fighting for equality, but dominance, and that discrimination against women is a thing of the past—are not only held by a large percentage of American women, but also dramatically influence their votes.
The average woman, if she has the lowest score on the Modern Sexism scale, has a 90% chance of choosing Clinton or Stein, but as that Modern Sexism score increases, that chance falls to 28%. The decline is just as steep for the average white woman, moving from an 81% probability to a 15% probability as her Modern Sexism score climbs from 5 to 25. Both the average woman who lives inside the South and the average woman who lives outside the South have the same probability range (90% to 28%), but it is important to note that those sub-groups include all races. Table 1d offers a more detailed breakdown of white southern women, specifically. Finally, even the average Democratic woman manages, though barely, to cross that tipping point, with only 48% chance of casting her ballot for a 2016 female candidate at the highest Modern Sexism score of 25, down 47 points from a 95% chance at the lowest score.
Table 1d provides a closer examination of the regional divide when it is limited to whites only, and it reveals some important differences. Unlike Figure 1d, Table 1d does not include the secondary measure of southern identity primarily because these models predict voting and because of the electoral college the election is a result of geography. For whites who live in the South, there are only four variables that predict voting for a female candidate in 2016, and they are all negatively related: party identification, ideology, Racial Resentment and Modern Sexism. Thus the more Republican, conservative, “racist,” and “sexist” a respondent from the South is, the less likely they are to vote for a woman. Among whites who live outside of the South, those same variables are significant, but additionally, higher levels of education, as well as being married, and being a woman in general, all significantly and positively influence the likelihood of voting for a woman.
Looking at white men who live outside of the South specifically, only party identification and Racial Resentment are significant, but for white men who live outside of the South, party identification and Modern Sexism are the primary drivers for not voting for a woman. Marriage, on the other hand, makes white men outside of the South more likely to select Clinton or Stein. Finally, it is important to note that while Modern Sexism does not appear to be significant among white men in the South in Table 1d, it is, in fact, significant at the .06 level with a one-tailed significance test (meaning Modern Sexism is predicted to work in one direction only—in this case negatively). This significance still matters because there is (a) little variation in the general election votes cast by white men in the South, (b) the sample sizes are smaller as the sub-group becomes more narrowly defined, and (c) there is so little variation in the high Modern Sexism scores of white men living in the South in the first place.
For white women who live in the South, Racial Resentment is only slightly significant, as is party identification and ideology, and Modern Sexism. The same is true for white women who live outside of the South, though, for them, age and education are also significant and positive. Thus, in the South, younger women are just as likely or unlikely to vote for a female candidate, but outside of the South, older women are more likely to do so. This speaks to the nature of Modern Sexism as a measure. Though attitudes may have changed over time regarding the innate inferiority of women, the resentment or dislike or distrust of working women is held by younger women—and men—too.
Table 1d: Logit Models Predicting Vote for a Female Candidate in the 2016 Election—WHITE Respondents by Gender and Region
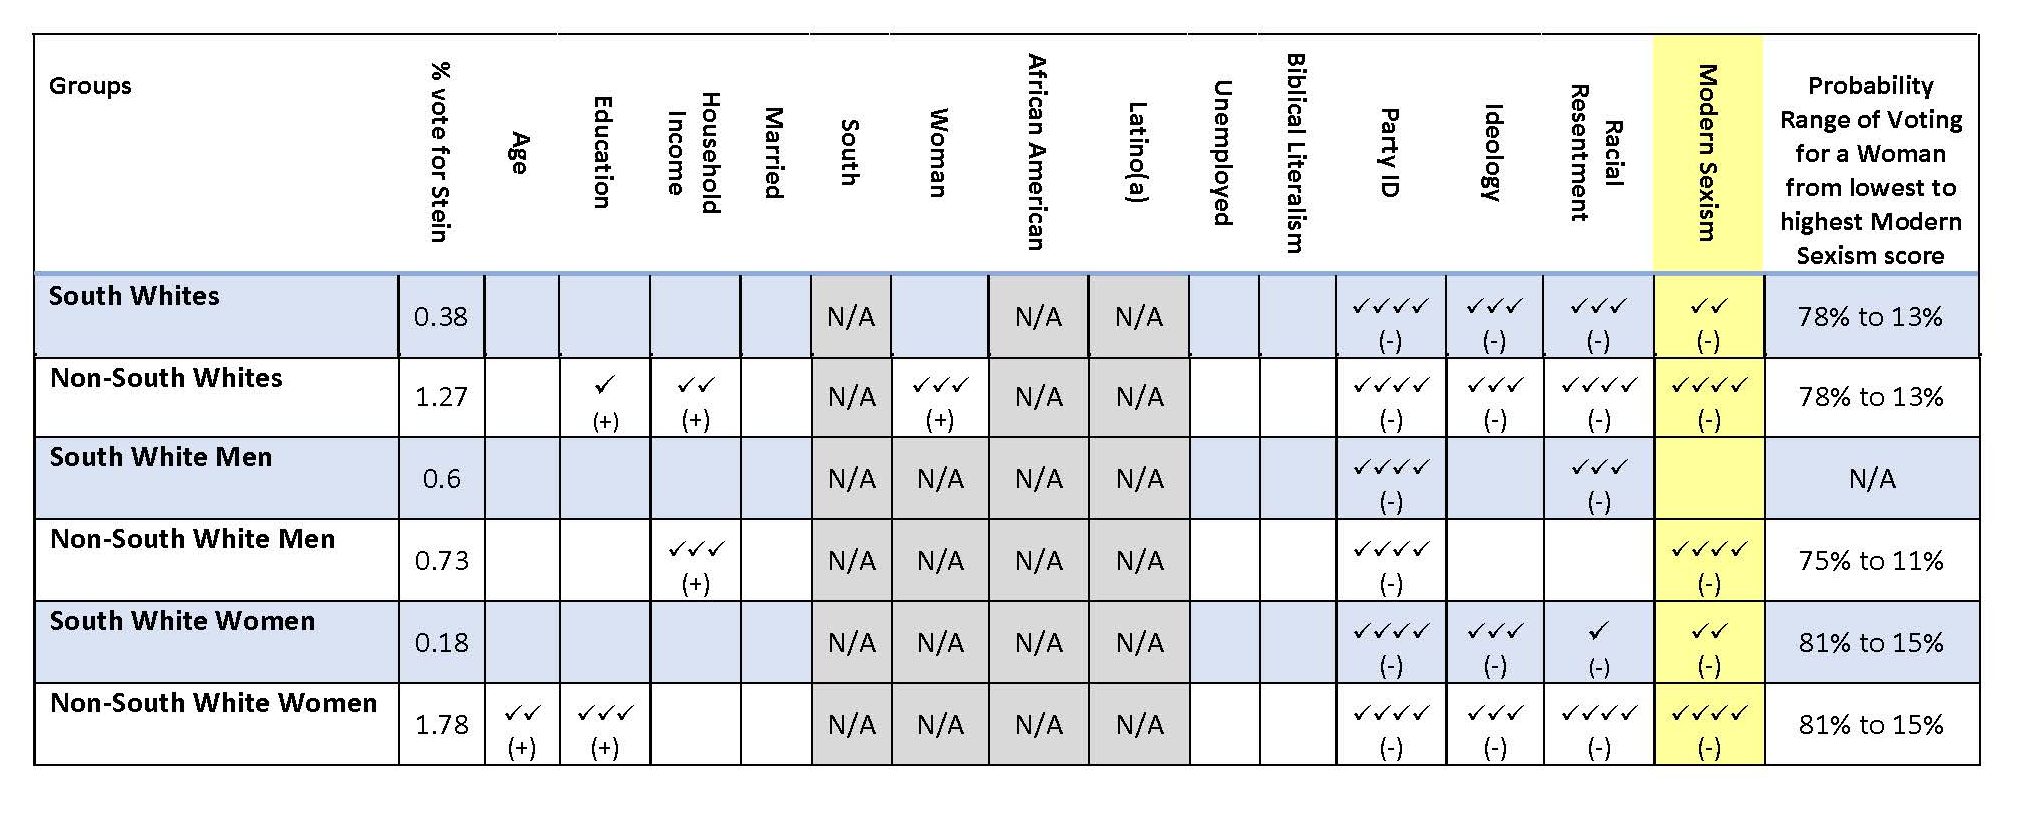
Table 1d: Logit Models Predicting Vote for a Female Candidate in the 2016 Election—WHITE Respondents by Gender and Region
To consider the scale of the impact of Modern Sexism on the 2016 presidential election, Table 2 estimates by race and gender, how many votes were unlikely to be cast for Clinton of Stein based on Modern Sexism. The first column contains the “tipping point” score on the Modern Sexism scale, whereby the average member of each sub-group moves from likely to unlikely in terms of voting for a female candidate in the 2016 presidential general election. Once the tipping point score is known, the percent of respondents in that subgroup who have that score or higher, can be estimated, as is shown in the second column. If this percentage of the sample is compared to exit poll data[14] regarding the turnout in the 2016 general election, then the number of votes based on “Modern Sexist” attitudes that are unlikely (less than a 50% chance when controlling for all other variables) to be cast for a female presidential candidate, can be estimated. These estimates appear in the third column.
Table 2: Estimated Number of Voters who were “unlikely” to vote for a Female Candidate in 2016 Election based on Modern Sexism
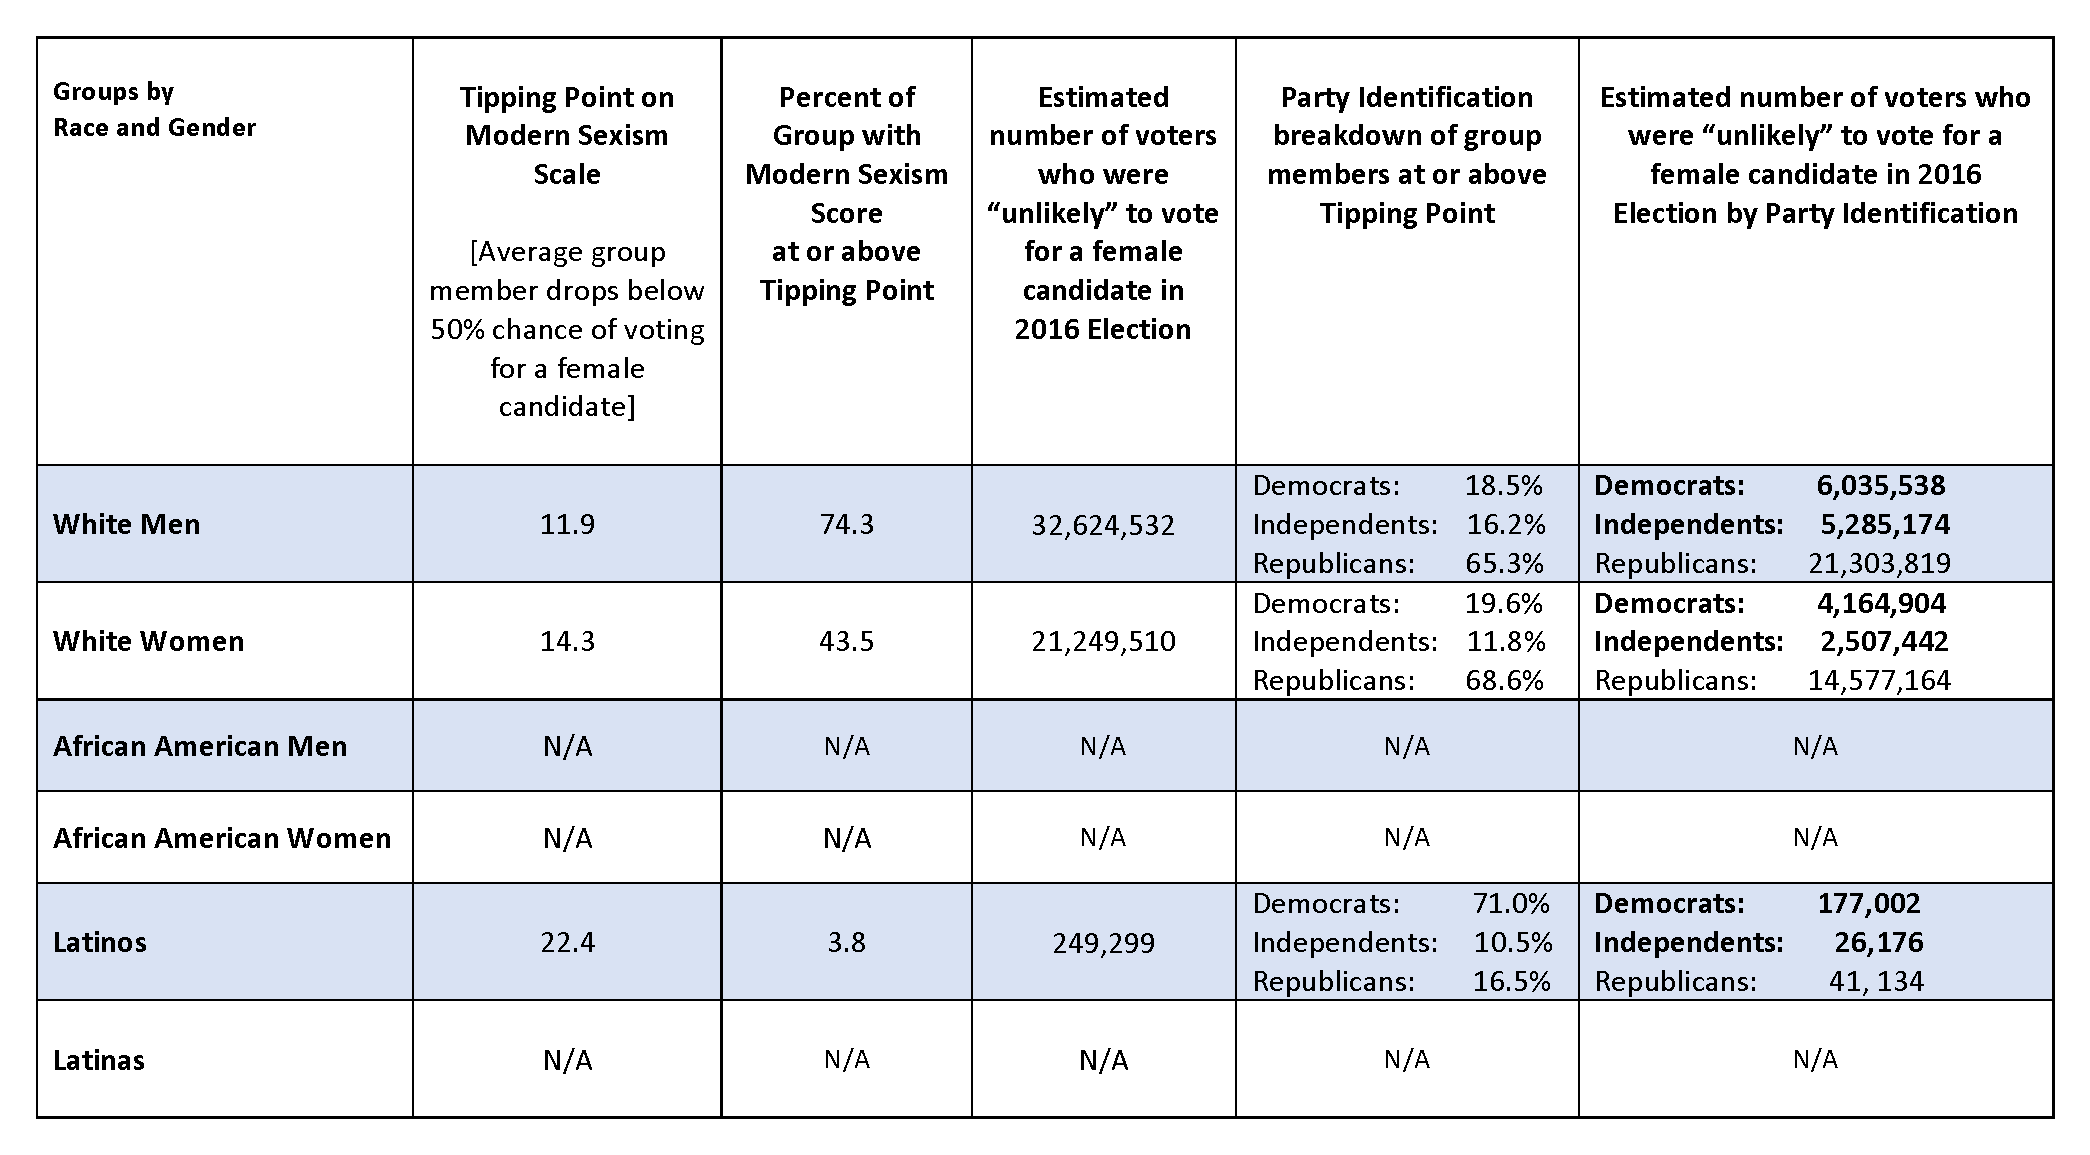
Table 2: Estimated Number of Voters who were “unlikely” to vote for a Female Candidate in 2016 Election based on Modern Sexism
As shown in Table 2, African American men and women, as well as Latinas, do not have a tipping point score on the Modern Sexism scale because Modern Sexism was not significant in predicting their likelihood to vote for a female candidate. For the average Latino, whose probability of voting for Clinton or Stein is 90% at the lowest Modern Sexism score and drops to 40% at the highest Modern Sexism score, the tipping point is crossed at a Modern Sexism score of 22.4 out of a possible 25. Once the average Latino voter has a Modern Sexism score that high, with all other variables held constant, his chance of voting for a female in the 2016 general election for president, drops below 50%. In the 2016 Blair Center Poll, there are 3.8 % of the Latinos who have a score higher than 22.4. Based on the number of Latinos who voted in the 2016 election, this translates to roughly 250,000 voters. As can be seen in the fourth column, of that 3.8% of Latinos who have a Modern Sexism score that is greater than 22.4, 71% are Democrats and 10.5% are Independents, which together account for roughly 200,000 of the 250,000 votes estimated as unlikely to be cast for a female due to Modern Sexism.
For the average white man, the likelihood of voting for Clinton or Stein decreases from 75% at the lowest Modern Sexism score of 5 to an 11% chance at the highest Modern Sexism score of 25. The tipping point score for white men is 11.9. This means that the average white man falls below a 50% chance of voting for Clinton and Stein while still in the “non-sexist” range of the “Modern Sexism” scale, with those chances dropping dramatically as the Modern Sexism score increases. Approximately 74.3% of white men in the sample have Modern Sexism scores above 11.9, which translates to over 32 million votes. Most of those white men over the tipping point are Republicans (65.3%). However, 18.5% and 16.2% are Democrats and Independents, respectively. That translates to more than 6 million Democratic votes, and more than 5 million Independent votes from white men that were “unlikely” to be cast for Clinton or Stein based on Modern Sexism.
The average white woman, at the “Modern Sexism” score of 5, with all other variables held at a constant, has an 81% chance of voting for Clinton or Stein. At the highest score of 25, that likelihood drops to 15%. The tipping point, whereby the average white woman’s probability of voting for a woman in the 2016 general election falls below 50%, is a Modern Sexism score of 14.3. In the 2016 Blair Center Poll, 43.4% of white women have a Modern Sexism score above 14.3, which translates to more than 21 million votes. Again, most white women who have a Modern Sexism score above the tipping point are Republicans (68.6%), while 19.6% are Democrats and 11.8% are Independents. That breakdown translates roughly to over 2.5 million votes from Independent white women and over 4 million votes from Democratic white women who were “unlikely” to be cast for a woman president based on the turnout in this past election and the Modern Sexism levels in this sample.
Summary of Findings
- “Modern Sexism” represents a contemporary form of sexism based not on a belief in female inferiority, but rather on resentment or hostility towards working women themselves. Modern Sexism, in other words, does not measure whether a woman is capable of being successful, but whether she will be liked and trusted as a working woman. In order to have a “sexist” score, respondents must, on average, agree that (a) discrimination against women is no longer a problem; (b) women complain about discrimination even when they lose to a man fairly; (c) that feminists want more power than men as opposed to equality; (d) that most women are too quick/too sensitive when labeling comments or actions as sexist; and (e) that women really just want preferential treatment in the workplace as opposed to equality. Even being neutral on these statements implies a distrust of working women and a denial of the inequities that women face. The percentage of Americans who hold these attitudes is extremely high, with the majority of Americans either being neutral or agreeing with these statements, as opposed to disagreeing. Thus, the notion that such pervasive animosity and dislike of working women would not have a major impact on female candidates for the U.S. Presidency is mistaken. Rather, the impact of these attitudes cannot be overstated.
- Modern Sexism is partisan. The dramatic gaps in the percentage of Democrats versus the percentage of Republicans who hold these attitudes means that such attitudes must be considered alongside party identification in any assessment of the electorate. Such distrust of working women and feminists, as well as a belief in a post-sexist America seems to be a core value among the majority of self-identified Republicans, which surely has policy ramifications.
- Modern Sexism is most pervasive among white Americans, and insignificant among African Americans in general. Latinos(as) report higher levels than African Americans, but lower levels than those reported by whites.
- Modern Sexism is not exclusive to men. Many American women also agree with this negative characterization of working women and feminists. White women report the highest levels by racial group, and half of all Republican women have a “sexist” score, which does not include those who have a “neutral” score. Only about 1/3 of Republican women actually disagree with these statements.
- Southern white distinctiveness in terms of Modern Sexism does exist, with more whites who live in the South reporting resentment or distrust of working women than whites who live outside of the South. However, these regional divides are much greater when identity as opposed to geography is measured. Modern Sexism proliferates among whites who actually identify as southerners.
- Modern Sexism had a major impact on the 2016 Presidential election:
- In the primaries/caucuses, candidates are easily demarcated by the percentage of their supporters who agree with this negative characterization of working women and feminists. The largest contingency of “sexists” supported Ted Cruz, followed by Donald Trump, in the Republican primaries/caucuses. On the Democratic side, a smaller portion of Bernie Sanders’ supporters held such attitudes compared to Hillary Clinton’s supporters. However, only 3 of 4 Sanders voters supported Clinton in the general election, and the Modern Sexism scores for those who did not correlated with who they chose, with 6% (and the highest mean Modern Sexism score) voting for Donald Trump, and close to 8% (with the second-highest mean Modern Sexism score) voting for Gary Johnson. Moreover, Modern Sexism was highly significant in a model predicting Sanders primary voters who did not vote for Clinton in the general election.
- In the general election, Modern Sexism proved highly significant in predicting who would vote for one of the two female options, primarily Clinton (Jill Stein received a little more than 1% of the vote in the sample). Only African Americans and Latinas were not significantly influenced by Modern Sexism. Among every other sub-group, agreement or disagreement with this portrayal of working women dramatically moves them from more likely to less likely to vote for a female candidate in 2016, making the Modern Sexism scale a critical measure in predicting elections. The average white woman, for example, if she strongly disagrees with all five questions on the scale, has an 81% chance of voting for Clinton or Stein. But if she strongly agrees with all five negative statements about working women and feminists, those chances fall to 15%, even controlling for the effects of all other variables, including education, income, ideology, racism, etc. The average Republican man, who strongly disagrees with all of the Modern Sexism questions, had a 69% chance of voting for a woman this election cycle, and if he strongly agrees with all of the questions, those chances plummet to 10%.
- There is a tipping point score on the Modern Sexism scale for every sub-group of Americans at which point they move from likely to vote for a woman to unlikely. Almost ¾ of white men have scores higher than their tipping point, as well as over 40% of white women, and a small fraction of Latinos. Of those white men with scores higher than their tipping point, meaning their Modern Sexism score makes them unlikely to vote for a woman, the vast majority are Republicans, but over 18% are Democrats and over 16% are Independents. Comparing these ratios to exit poll data from the election, means that roughly 11 million white male Independents and Democrats feel enough animosity towards working women and feminists to make them unlikely to vote for one of them—even from their own party. Among white women who have a Modern Sexism score over their tipping point, the overwhelming majority are, again, Republicans, but almost 20% are Democrats, and another 12% are Independents. For white, female Democrats and Independents, this translates to over 6.5 million votes at risk of not being cast for a female presidential candidate based on Modern Sexism.
[1] Jone Johnson Lewis. 2017. “Women Who Ran for President.” Thought.co. (26 April) https://www.thoughtco.com/women-who-ran-for-president-3529994 (Accessed 7 May, 2017).
[2] Jeffrey M. Jones and David W. Moore. 2003. “Generational Differences in Support for a Woman President.” Gallup (17 June) http://www.gallup.com/poll/8656/generational-differences-support-woman-president.aspx (Accessed June 5, 2015).
[3] Andrew Kohut. 2007. “Are Americans Ready to Elect a Female President?” PewResearchCenter (9 May) http://www.google.com/url?sa=t&rct=j&q=&esrc=s&source=web&cd=1&ved=0CB0QFjAAahUKEwinj–K74PJAhWROYgKHdN0BEk&url=http%3A%2F%2Fwww.pewresearch.org%2F2007%2F05%2F09%2Fare-americans-ready-to-elect-a-female-president%2F&usg=AFQjCNF-RE0ywzh7oRAhBug10SiQyG3nPw&bvm=bv.106923889,d.cGU (Accessed June 5, 2015).
[4] “Hoping to See a Women in the White House? Answer Depends More on Party Thank Gender.” 2015. Pew Research Center (13 January). http://www.pewsocialtrends.org/2015/01/14/women-and-leadership/st_2015-01-14_women-leadership-0-07/ (Accessed April 2, 2017).
[5] “Madame President: Changing Attitudes about a Woman President.” Roper Center for Public Opinion Research, Cornell University. https://ropercenter.cornell.edu/changing-attitudes-about-a-woman-president/(Accessed 10 May, 2017).
[6] Matthew J. Streb, Barbara Burrell, Brian Frederick, and Michael A. Genovese. 2008.“Social Desirability Effects and Support for a Female American President.” Public Opinion Quarterly 72 (1): 76-89. [7] Leonie Huddy and Nayda Terkildsen. 1993. “The Consequences of Gender Stereotypes for Women Candidates at Different Levels and Types of Offices. Political Research Quarterly 46 (3): 503-525.
[8] David Lublin and Sarah E. Brewer. 2003. “The Continuing Dominance of Traditional Gender Roles in Southern Elections.” Social Science Quarterly 84 (2): 380-396.
[9] For more information, see: Melanie A. Morrison, Todd G. Morrison, Gregory A. Pope, and Bruno D. Zumbo. 1999. “An Investigation of Measures of Modern and Old-Fashioned Sexism.” Social Indicators Research 48 (1): 39-50.
[10] Janet K. Swim, Kathryn J. Aiken, Wayne S. Hall, and Barbara A. Hunter. 1995. “Sexism and Racism: Old-Fashioned and Modern Prejudices.” Journal of Personality and Social Psychology 68 (2): 199-214.
[11] Pamela Johnston Conover. 1988. “Feminists and the Gender Gap.” The Journal of Politics 50 (4): 985-1010, 1005.
[12] Elizabeth Adell Cook and Clyde Wilcox. 1991. “Feminism and the Gender Gap—A Second Look.” The Journal of Politics 53 (4): 1111-1122.
[13] For more information, see: http://www.knowledgenetworks.com/ganp/
[14] For more information, see: http://www.cnn.com/election/results/exit-polls